
The ⚡Quick Insights page gives a fast overview of project performance.
Teams can quickly monitor productivity, spot bottlenecks, and track progress without going through detailed reports.
With real-time metrics and visual summaries, Quick Insights helps teams act fast and keep projects on track.
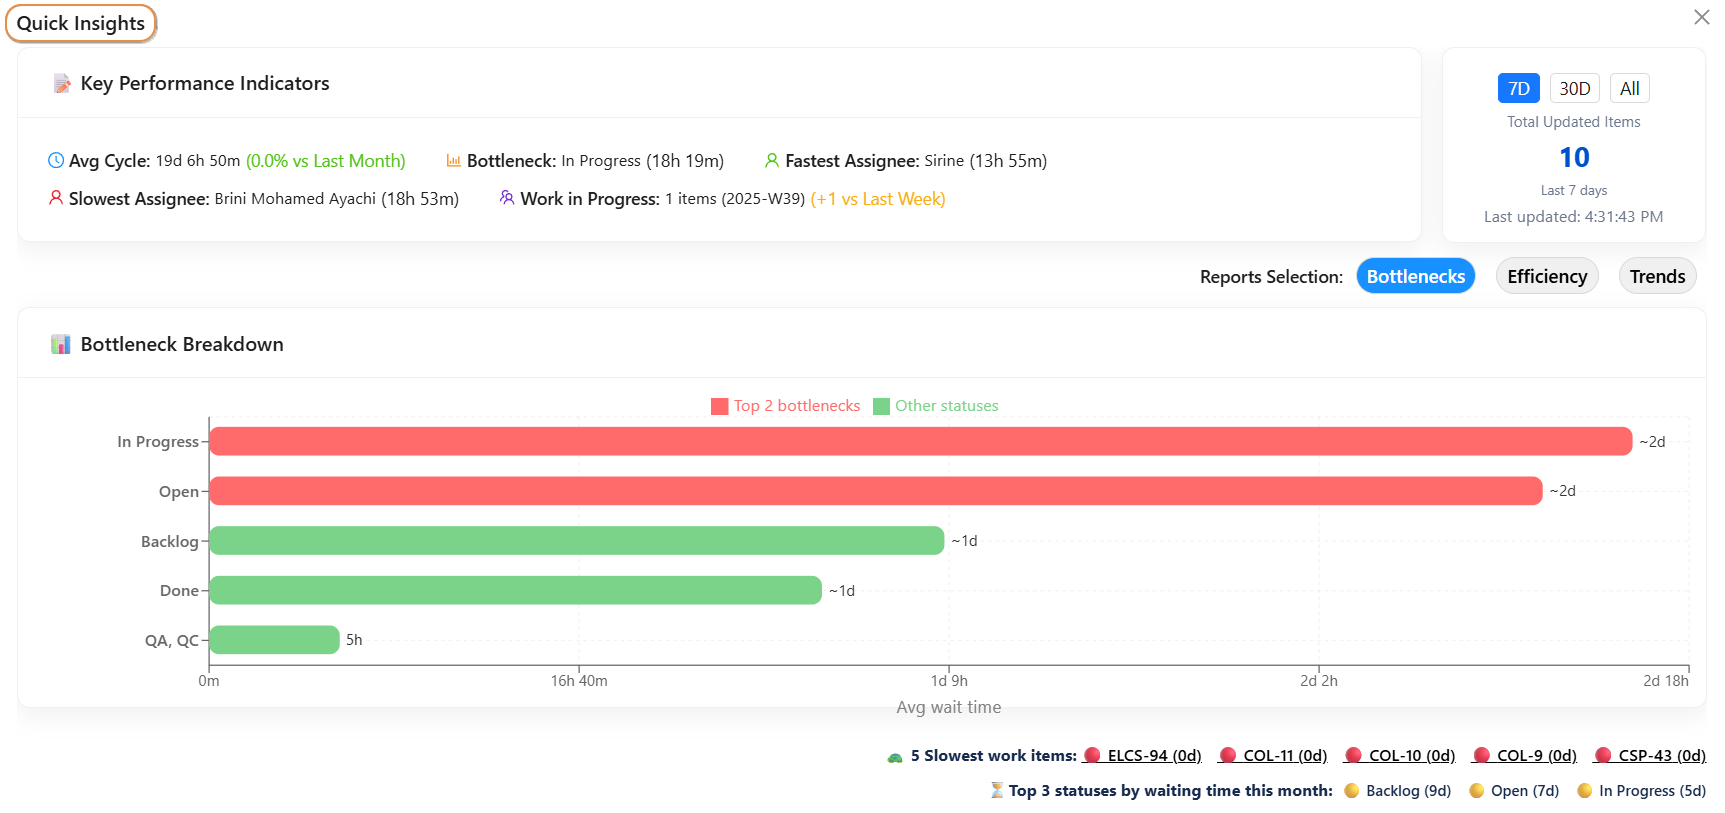
Key Performance Indicators (KPI)
At the top of the page, you’ll find the most important KPIs to give a quick snapshot of project health:
-
Average Cycle Time ⏱️ : Time taken to complete tasks, compared with the previous month.
-
Bottleneck Status ⚠️ : The workflow stage causing the longest delays ( example status ‘In progress’).
-
Fastest Assignee 🚀 : Team member completing tasks the quickest.
-
Slowest Assignee 🐢 : Team member taking the longest to complete tasks.
-
Work in Progress (WIP) 🔄 : Number of items currently in progress, compared with the previous week.
-
Updated Items ✏️: Total number of items updated during the selected period.
--> You can switch between timeframes: 7D, 30D, or All, to monitor short-term or long-term performance.
These KPIs help teams quickly see performance, identify delays, and understand workload, so they can make faster decisions.
Report Types
Quick Insights has three main report categories, each showing a different view of performance:
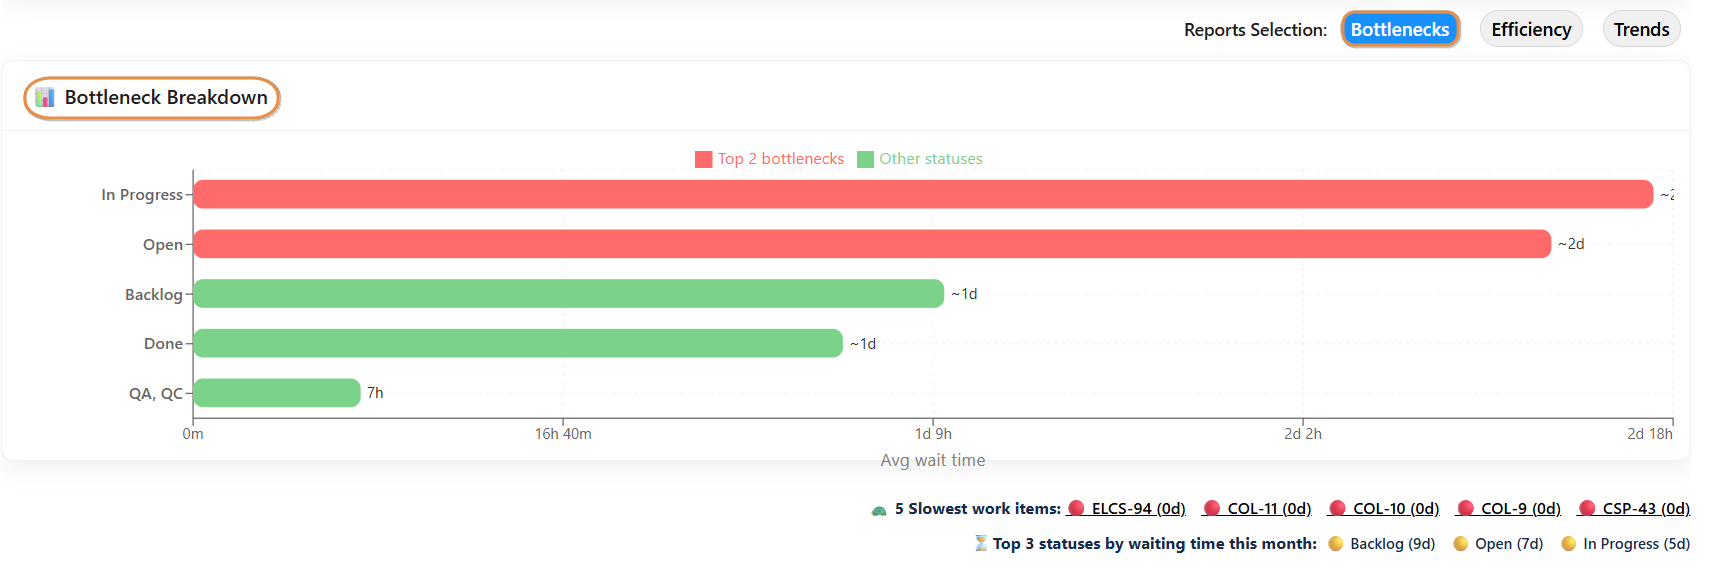
Bottlenecks
-
Shows where work gets stuck in the process
-
Highlights workflow stages with the longest delays
-
Helps teams spot and fix slowdowns quickly
-
Includes a Bottleneck Breakdown chart to visualize stuck tasks
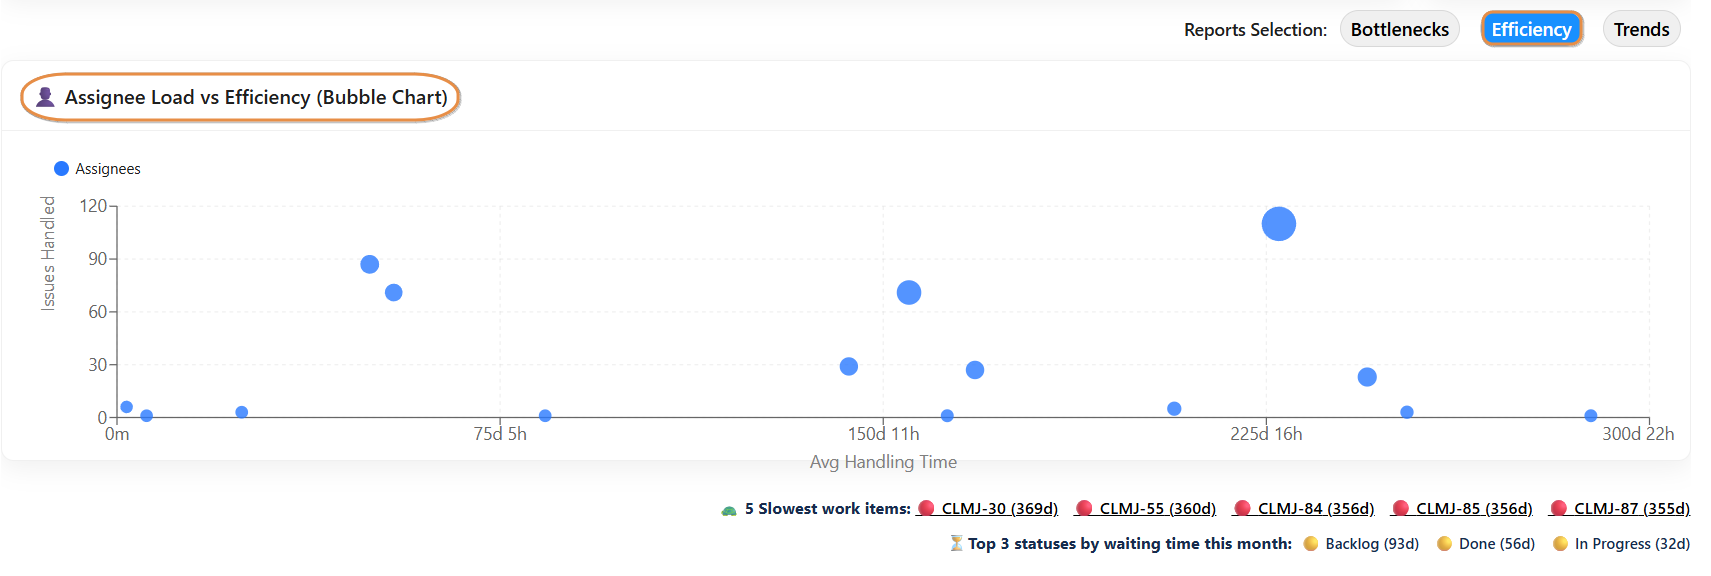
Efficiency
-
Measures team productivity and identifies areas for improvement
-
Interactive charts: Click on any chart bubble to see the user, the work items they handled, total time spent, and average handling time
Trends
-
This report shows how the average cycle time of tasks changes over time, helping you track performance and spot trends.
Interpretation of the lines:
-
Blue line : Weekly average cycle time
-
Green dashed line : 4-week rolling average
-
Red dashed line : Overall benchmark average
X-axis: Weeks
Y-axis:Cycle Time in days -
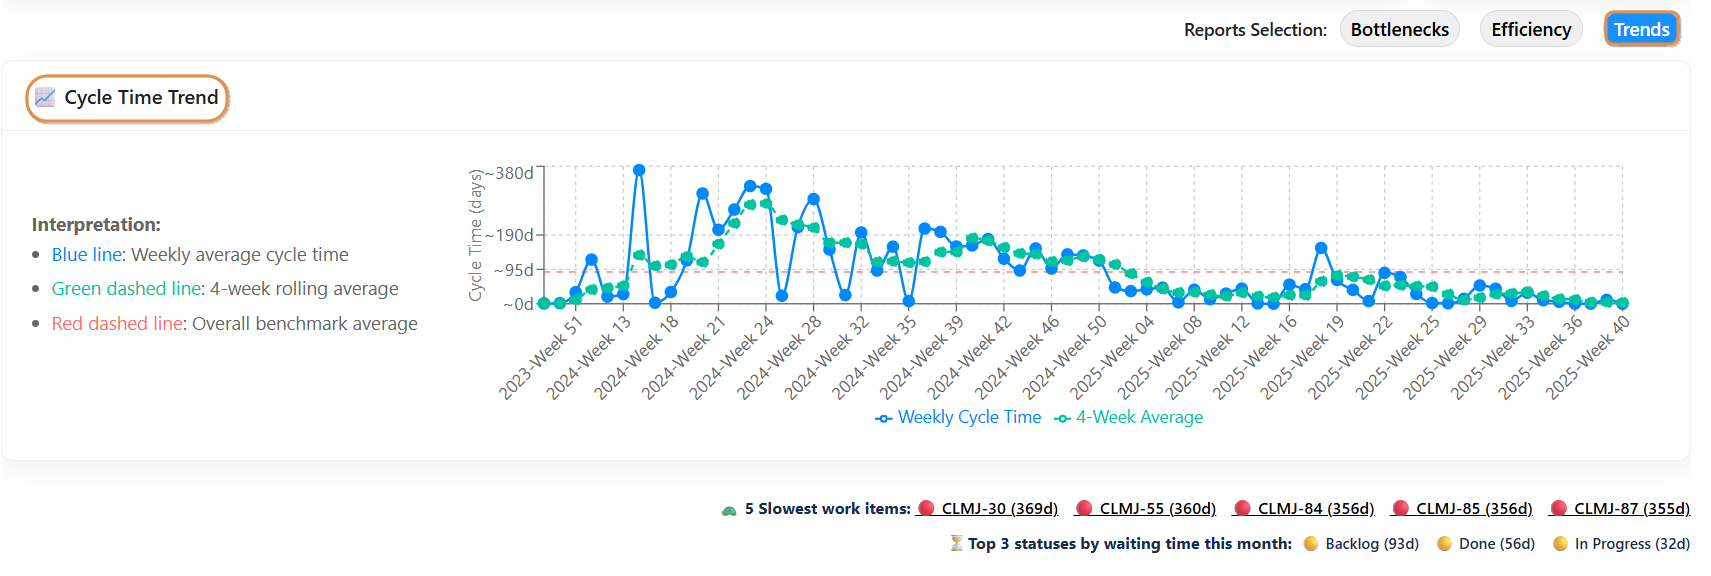
Use this chart to see short-term fluctuations (weekly), smoother trends (4-week average), and how performance compares to the overall benchmark.
Conclusion
-
The Quick Insights page gives teams a fast view of project health. By combining KPIs with reports on Bottlenecks, Efficiency, and Trends, teams can spot issues early, celebrate successes, and adjust plans confidently.
Whether tracking short-term results or long-term trends, Quick Insights provides reliable, real-time data to guide better decisions.
Need help?
🤝 We're here for you! If you have any questions, suggestions, or feature requests, feel free to reach out — we typically respond within 4 hours