
The Deep Activity Gadget is a powerful and customizable gadget designed to help you monitor key activity changes in your Jira instance directly from your dashboard.
Whether you're tracking updates across projects, monitoring specific changes, or highlighting trends in your workflows, this dashboard gives you a centralized, visual overview of what's happening.
This guide walks you through the steps to add, configure, and customize the Deep Activity gadget, ensuring you make the most of its advanced filtering, search, and highlighting capabilities.
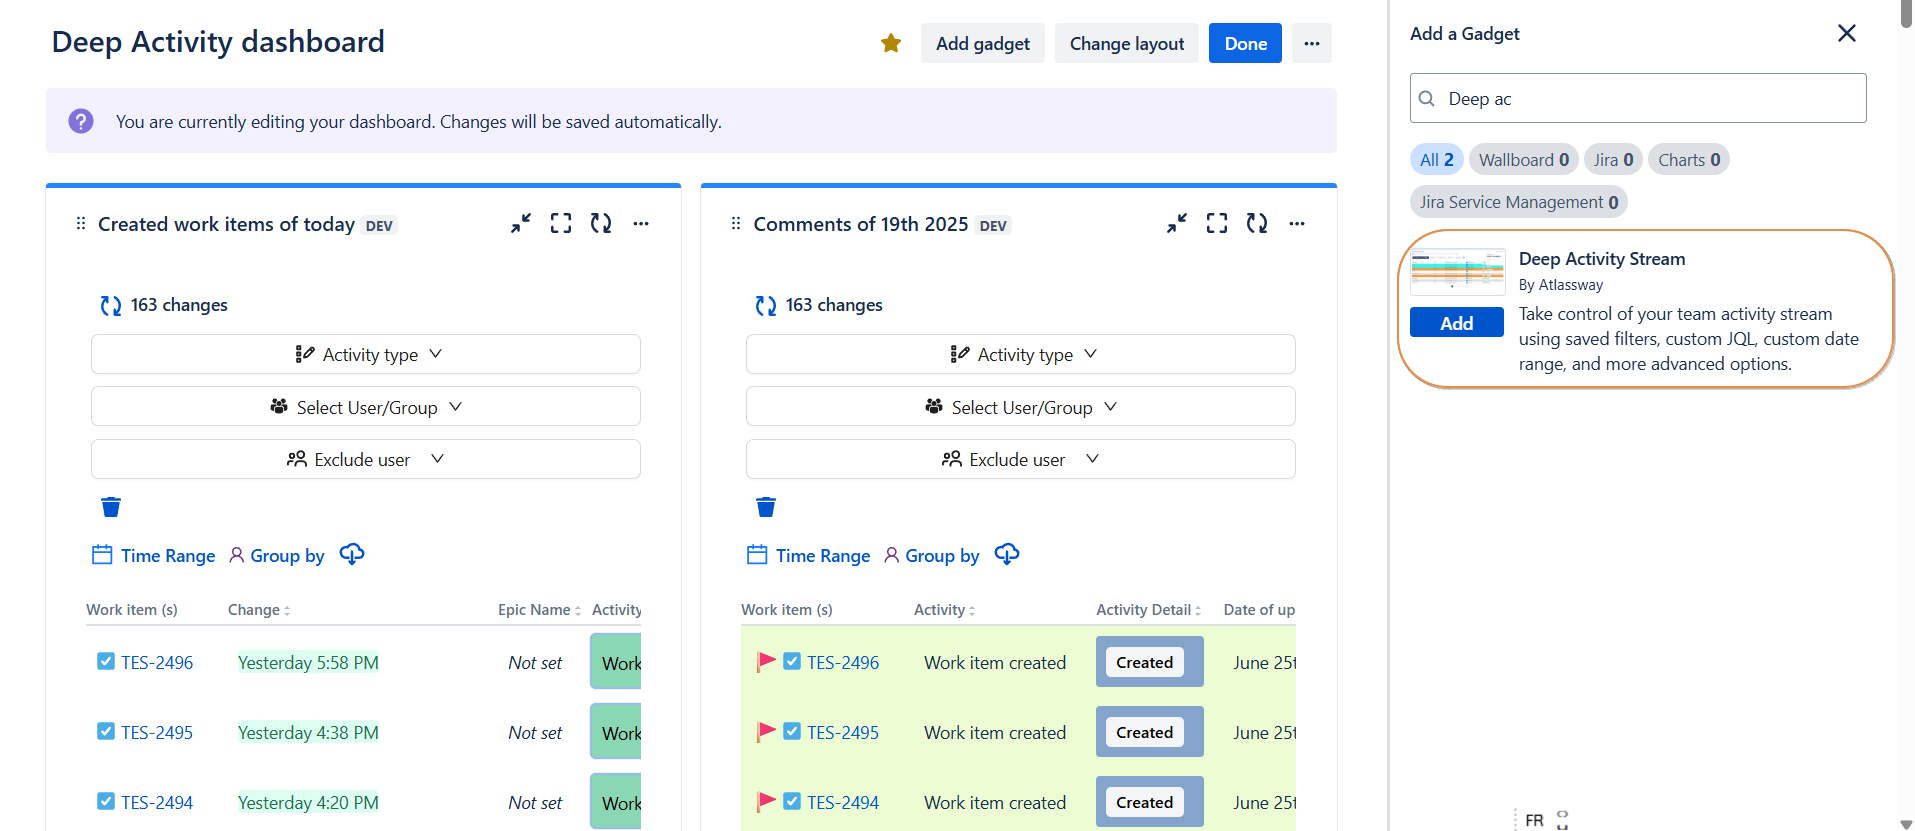
Adding the Deep Activity Gadget
To start using the Deep Activity gadget on your Jira dashboard:
-
Navigate to your Dashboard.
-
Click the Edit button (top-right).
-
Click Add a Gadget.
-
In the gadget directory, search for Deep Activity.
-
Select and add the gadget to your dashboard.
Once added, you’ll be able to configure the gadget according to your needs.
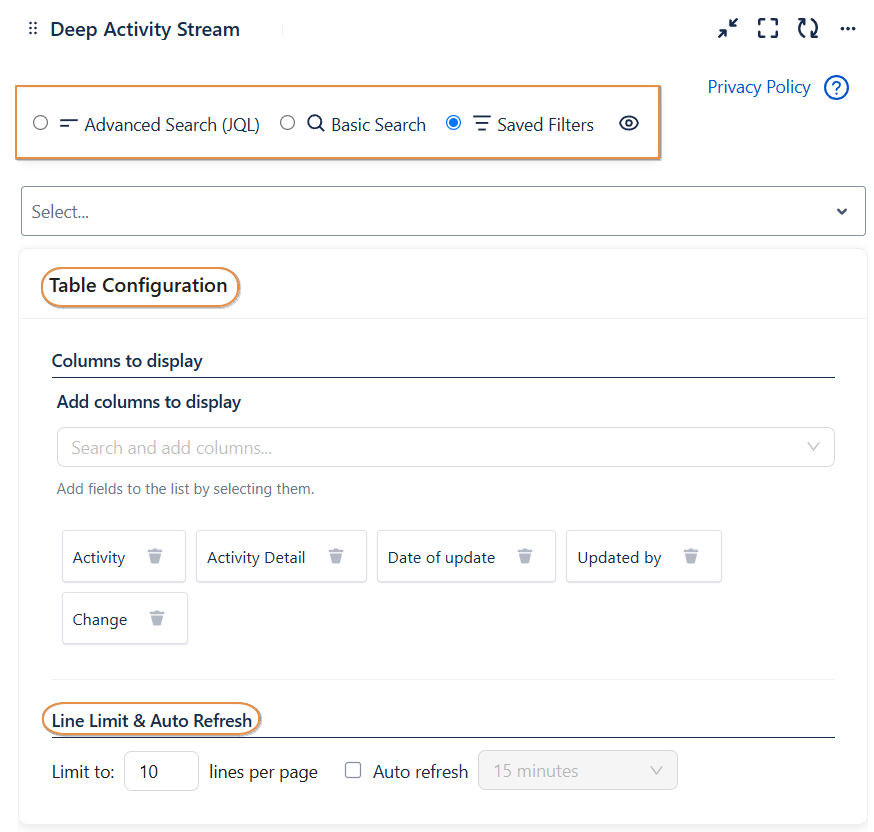
Configuration Fields
Once the gadget is selected, you'll be presented with multiple configuration options:
Search & Filtering Options
-
Advanced Search (JQL)
Write custom JQL queries to filter the data precisely. -
Basic Search
Use simplified fields for quick filtering without JQL. -
Saved Filters
Apply existing Jira filters you’ve saved.
Table Configuration
Customize the table content to display the most relevant data:
-
Columns to Display
Add or remove columns to tailor the view. Available fields include:-
Activity -
Activity Detail -
Date of update -
Updated by -
Change
-
-
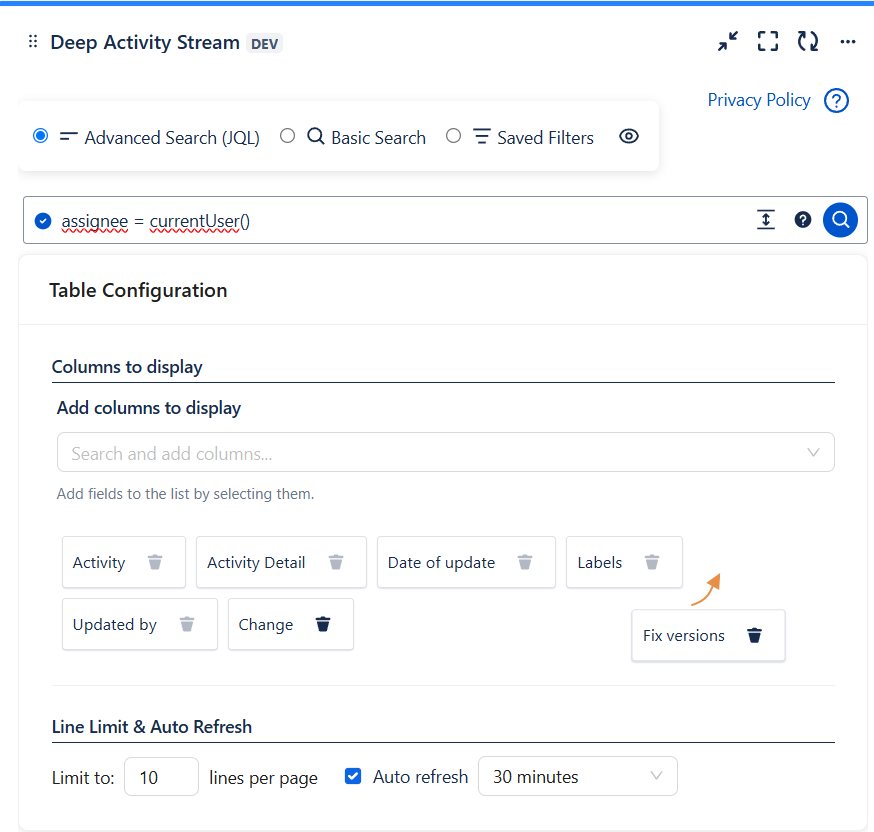
Add Columns to Display
Start typing to search and add new fields. -
Modify the order of columns
You can change the order of the columns by simply dragging and dropping them into your preferred arrangement.
Line Limit & Auto Refresh
-
Limit to [X] lines per page
Define how many activity lines are displayed at once (10 lines). -
Auto Refresh
Enable the dashboard to refresh automatically to keep your data up to date.
Example of configuration :
Highlights
Emphasize important activities visually with highlight rules.
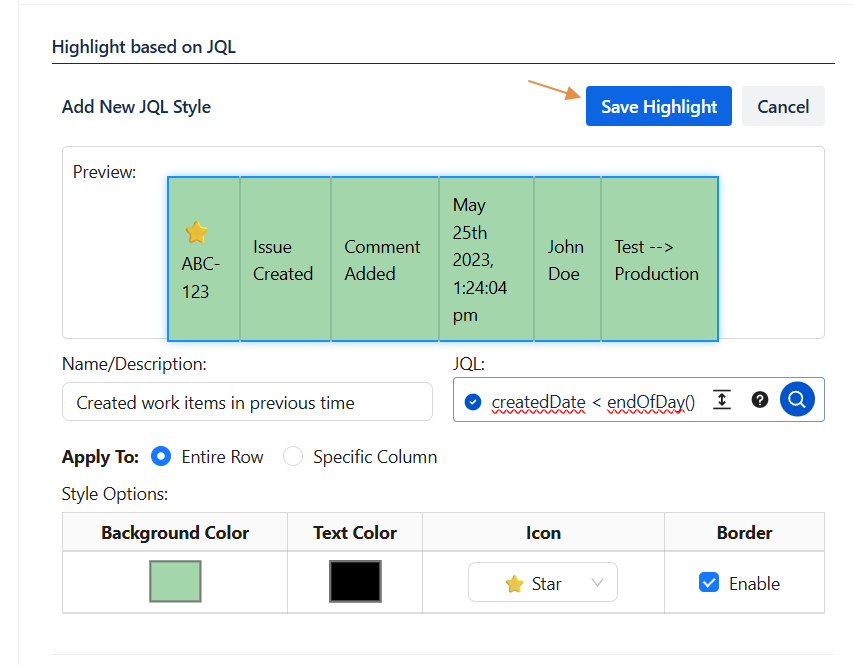
Highlight Based on JQL
Create custom highlight rules using JQL expressions:
-
Name/Description
-
JQL (to define the condition)
-
Target (which field to highlight)
-
Style Preview (color, icon, etc.)
Then Click on Save highlight
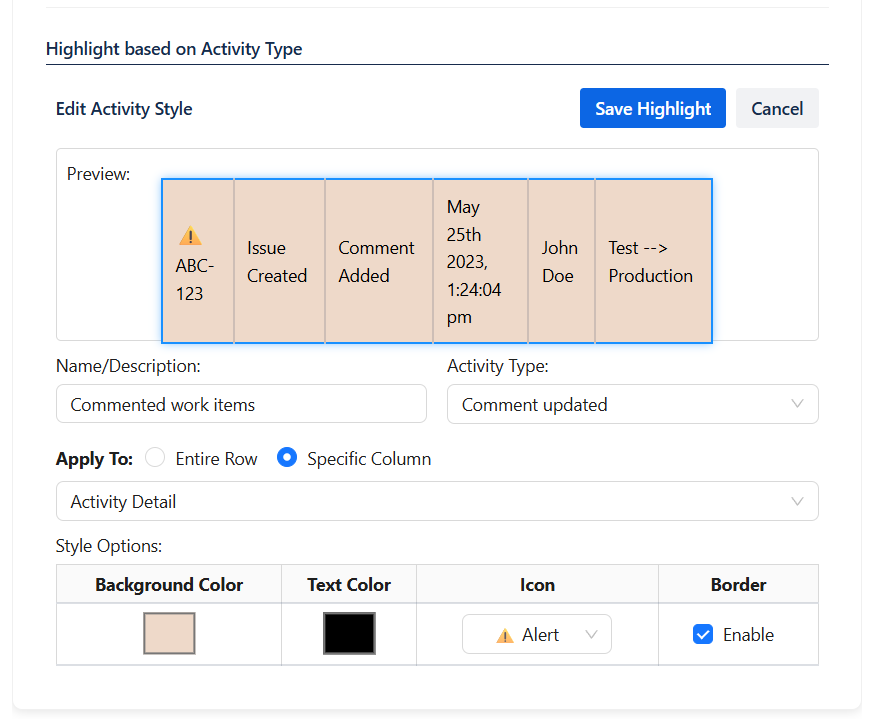
Highlight Based on Activity Type
Highlight based on predefined activity types:
-
Name/Description
-
Activity (comment added, status changed)
-
Target
-
Style Preview
Then Click on Save highlight
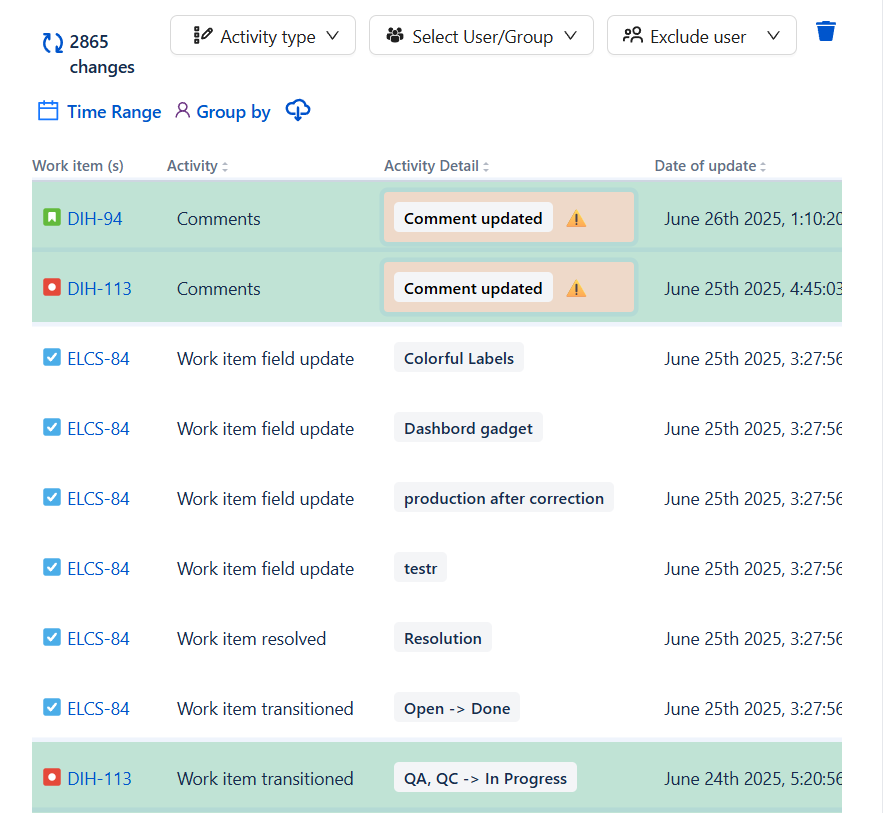
📌 You can add multiple highlight rules to visually prioritize what matters most.
As a result of two highlights applied in the same gadget :
Final Step: Save & Preview
After finishing your configuration:
-
Click Save to apply your settings.
-
The gadget will now load based on your selected filters and configurations.
-
You can always return to edit and adjust the gadget as needed.
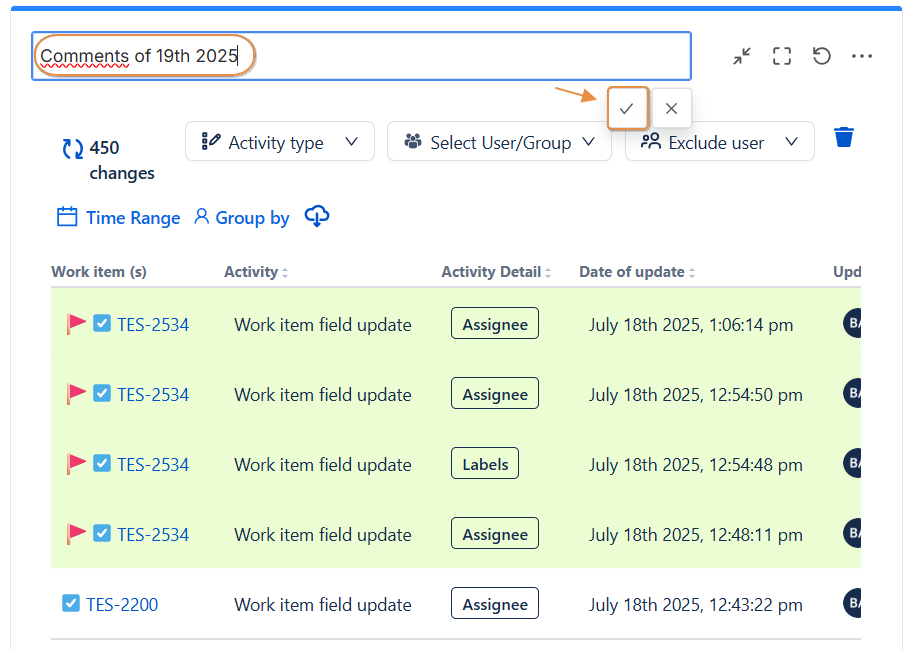
Rename Gadget
To rename a gadget:
-
Click directly on the gadget's title.
-
Edit the name as desired.
-
Once you're done, click the ✔️ check icon to save your changes.
Your new title will be applied immediately.
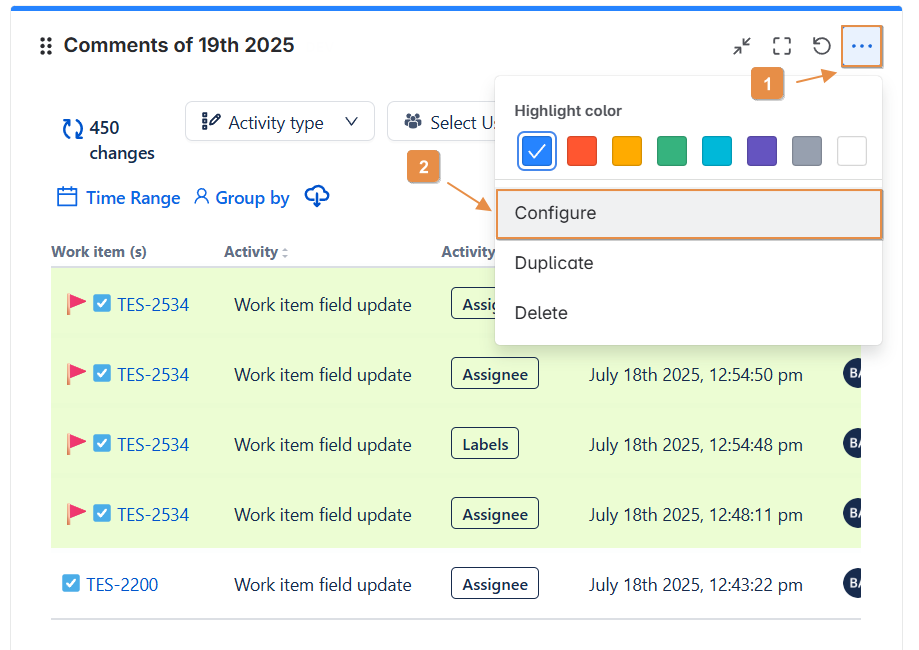
⚙️ Reconfigure a Gadget
If you want to update the settings of a gadget after it’s been added:
-
Click on the “⋯” (More) icon in the top-right corner of the gadget.
-
Select Configure from the dropdown menu.
-
Adjust the configuration based on your needs.
-
Click Save to apply the changes.
Your gadget will be updated immediately with the new settings.
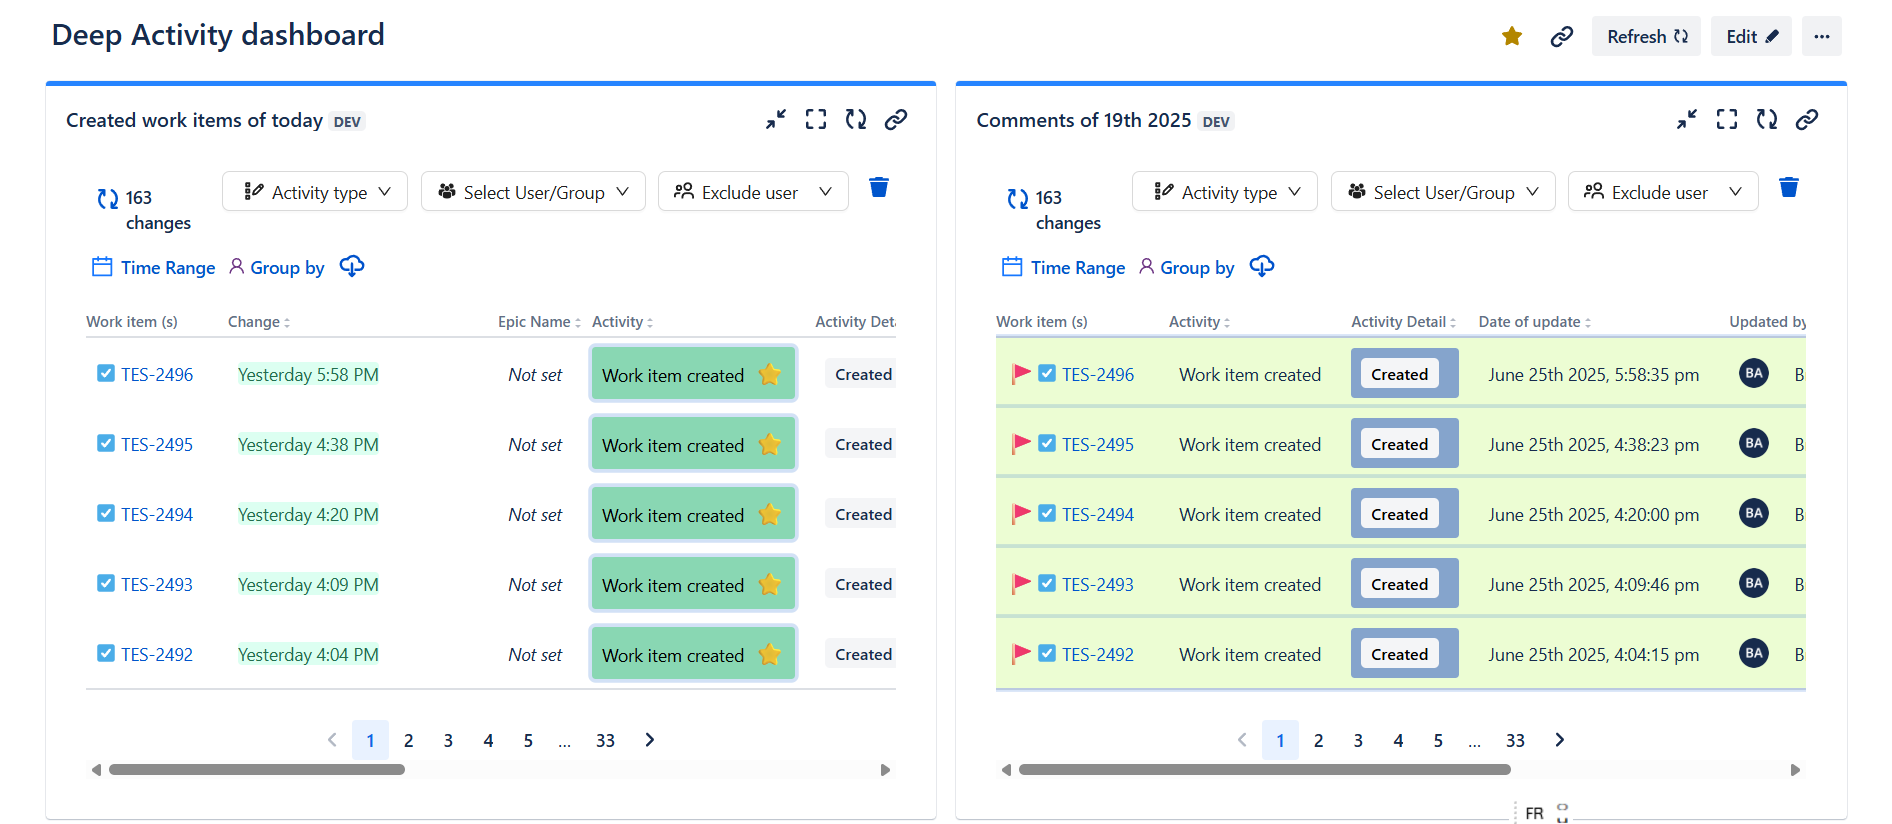
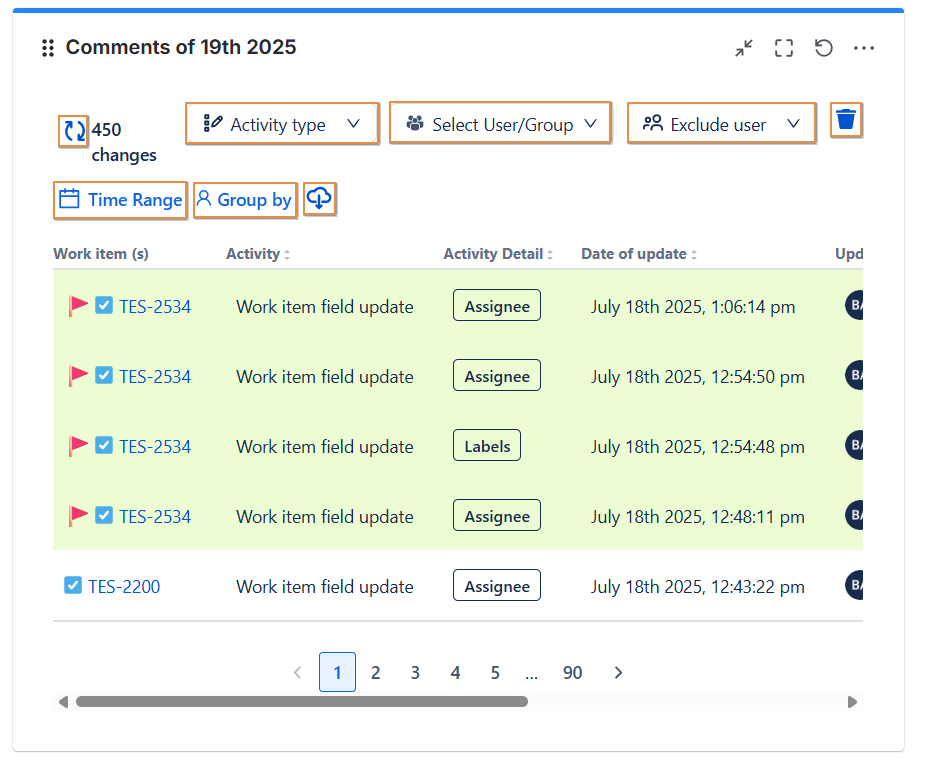
Using Filters and Actions in a Saved Gadget
Once a gadget is saved, several filters and actions become available to help you customize your view:
🧩 Available Filters:
-
Activity Type :Filter by specific activities (comments, status changes).
-
User/Group Selection : Focus the view on specific users or groups.
-
Exclude Users : Omit selected users from the activity stream.
-
Time Range : Define the period you want to analyze.
-
Group By : Organize results by activity type, date and user
📤 Additional Actions:
-
Export : Export the current view as a
.CSVfile or.PNGimage. -
Refresh : Click the Refresh button to apply new changes and reload the data.
-
Delete Filter : To remove a specific filter (Activity Type, User/Group, or Exclude), click the trash bin icon.
These controls give you flexibility to explore your data and focus on the insights that matter most.
Customer Use Cases
These are real examples of how customers are using our dashboard and activity reporting features to solve everyday challenges.
📌 Daily Operational Insights
“We need to check how many tickets were created or resolved today, who created them, who updated the description, or added comments. That’s exactly what we expect from the gadget.”
This use case highlights the need for real-time activity tracking across support tickets enabling teams to stay informed about the latest updates, contributors, and overall ticket volume throughout the day.
🧑💻 Custom Activity Streams
“We need a customizable activity feed. Especially when many people share the same Jira project, engineers want to filter by specific initiatives or areas.”
Ideal for larger teams working in shared environments, this request reflects the importance of personalized and filtered activity views to avoid information overload and focus on relevant work streams.
🔍 Filter-Based Monitoring
“I have a saved filter like: project = Project A OR (project = Project B AND component = 'My Component') I’d like to monitor this filter in an activity stream.”
This use case demonstrates the need to track activity based on complex filters, combining projects and components ,a key capability for multi-project management.Customer Use Cases
These are real examples of how customers are using our dashboard and activity reporting features to solve everyday challenges.
📅 Weekly Reporting Accountability
“We've added a ‘Weekly Status Update’ custom field, and we need our PMs/POs to update it before Friday’s report. We want a quick way to identify which issues are updated and which ones still need attention.”
This emphasizes the value of custom field monitoring within dashboards ,helping teams manage weekly planning cycles and ensure updates are completed on time.
You're Ready!
The Deep Activity Dashboard offers a flexible and powerful way to track Jira activity in real-time. Whether you're a project manager, admin, or team member, this gadget ensures you're always informed and in control of what's happening.
Need help?
🤝 We're here for you! If you have any questions, suggestions, or feature requests, feel free to reach out — we typically respond within 4 hours.