
📌 Detailed Reports are essential for users who want to dive deeper into data across various dimensions—user activity, transitions, audit logs, sprints, and more. Each report comes with multiple visualization options and a powerful Show Configuration panel to tailor the data to your specific needs.
Let's explore each report type in more detail 👇
Reports type
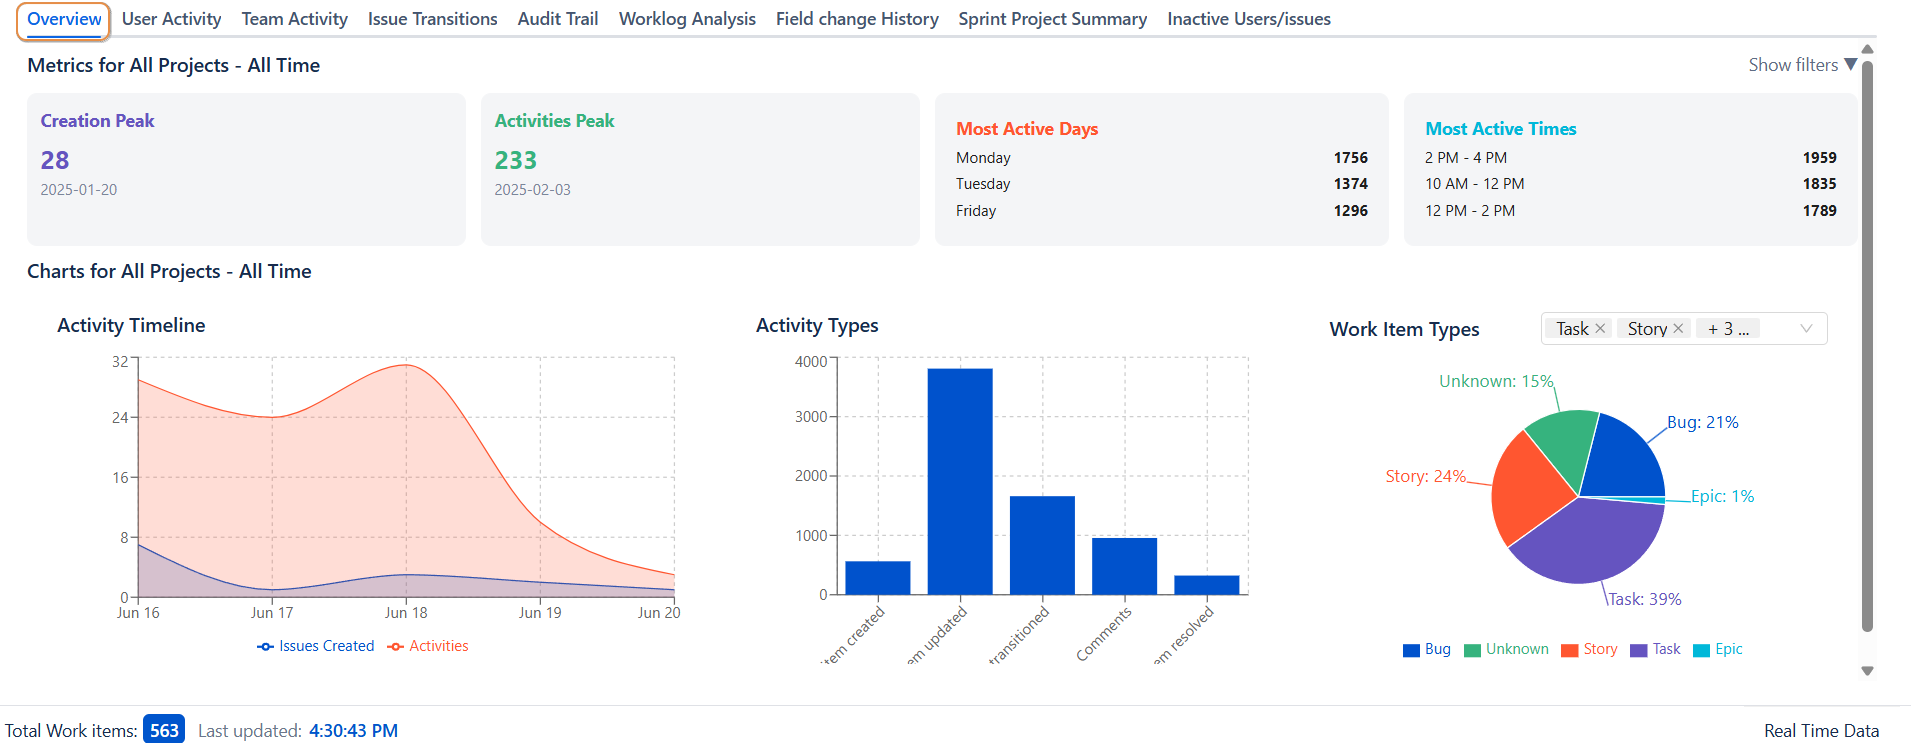
Overview
-
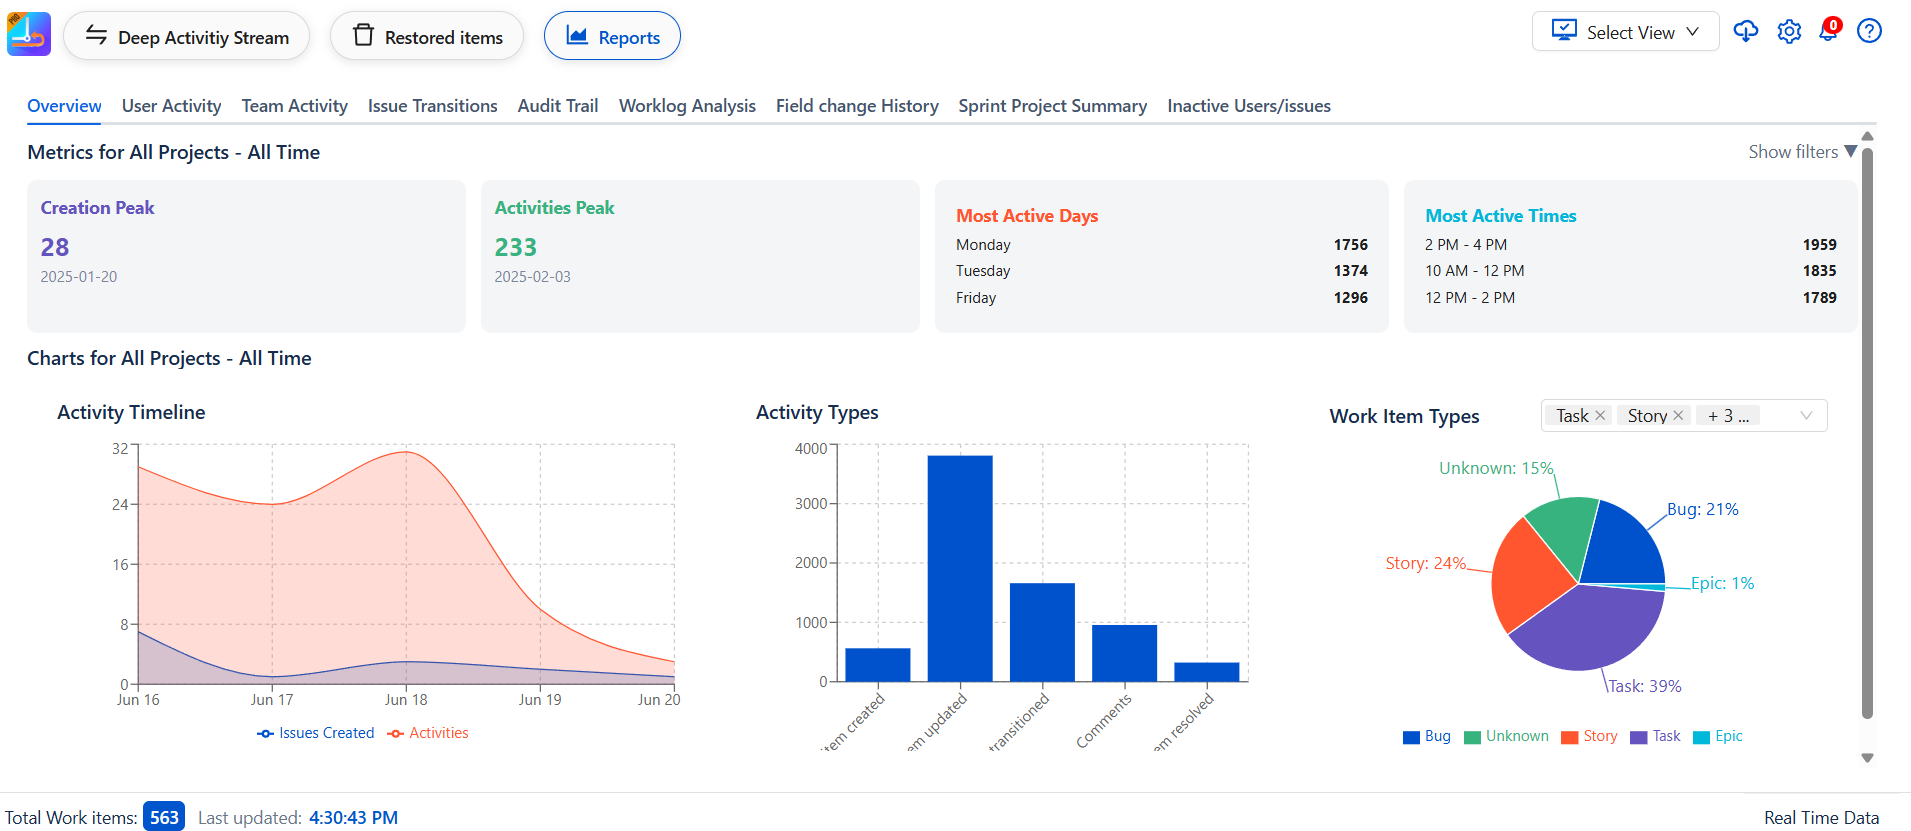
The Overview section gives you a comprehensive snapshot of Work-item activity across your projects helping you understand what’s happening, when, and where your team’s efforts are focused.
Key Highlights
🔝 Performance Peaks
-
Creation Peak
-
Activity Peak
📅 Most Active Days
Understand team rhythms with a breakdown of activity by weekday
🕒 Most Active Times
-
Discover peak hours when your teams are most engaged
Activity Type
-
Get a categorized view of the different actions performed across Work-items including field updates, activities and creations. This helps you identify the most frequent types of changes happening in your workspace.
Activity Timeline
-
Track how Work-item changes evolve over time. This timeline view lets you analyze patterns and spot peak periods of updates, making it easier to plan and allocate resources.
Work Item Types
-
This chart shows the percentage of work items created across all projects, grouped by type. It helps you quickly understand where your teams are focusing their efforts whether it’s delivering new features, handling bugs, or planning large initiatives.
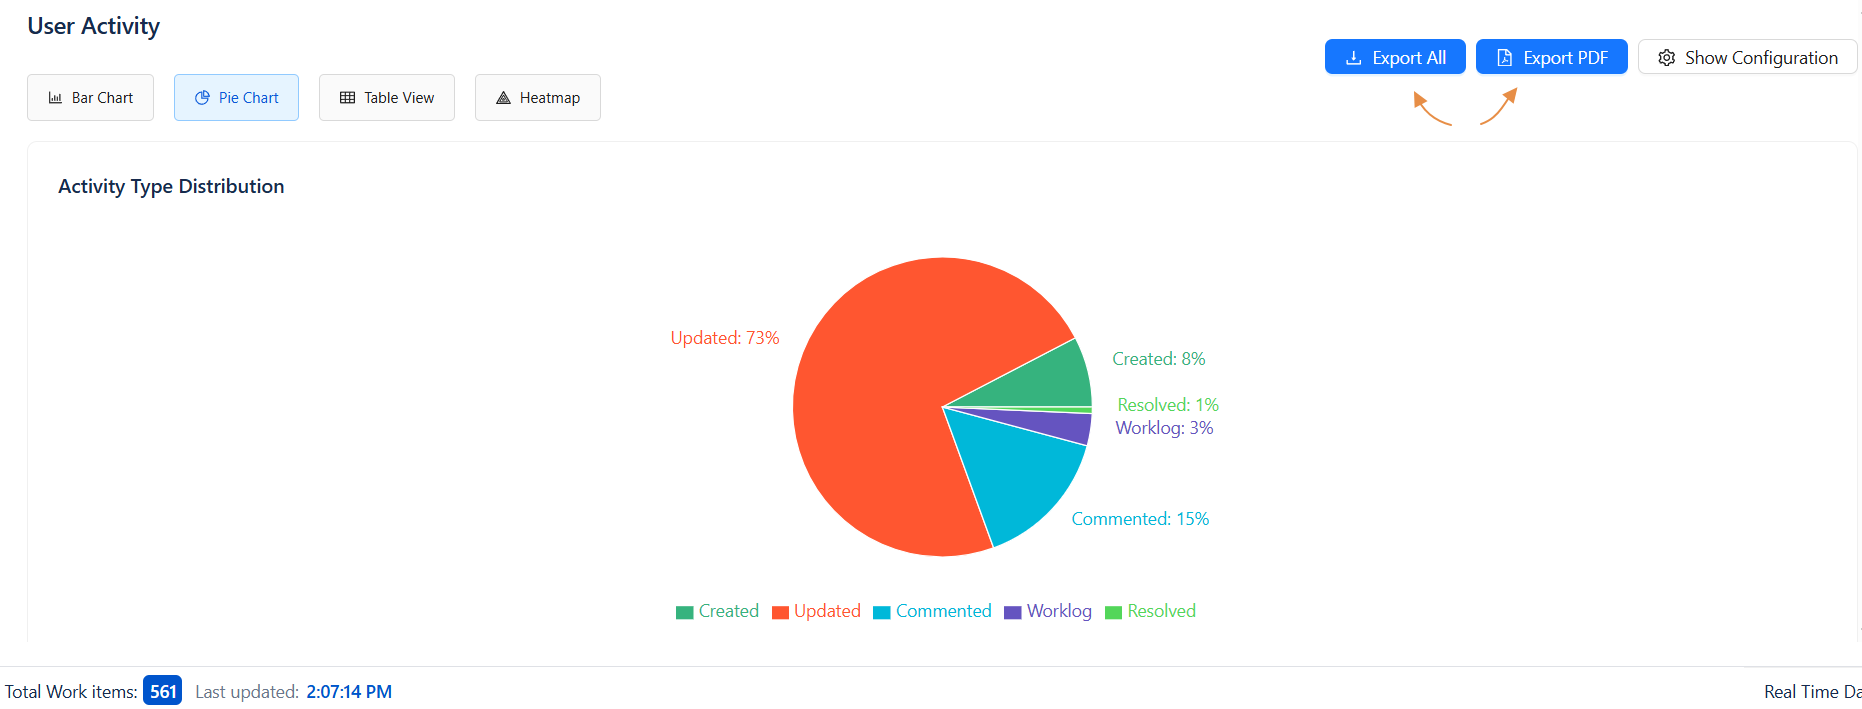
User Activity Report
-
Using this report allows you to monitor and compare the activity levels of users within a specific period. It is ideal for tracking engagement, contribution, or workload.
Views Available
-
Bar Chart
Displays a side-by-side comparison of total activities performed by each user. This chart helps identify the most and least active participants at a glance. -
Pie Chart
Illustrates the proportion of each user's contribution to overall activity. Useful for understanding how work or interaction is distributed among users. -
Table View
Presents detailed, record-level data in a tabular format. Ideal for reviewing individual activities, filtering data, and exporting raw information. -
Heatmap
Shows the intensity of activity distributed across days and hours. This visual helps detect usage patterns, peak times, and periods of low engagement.
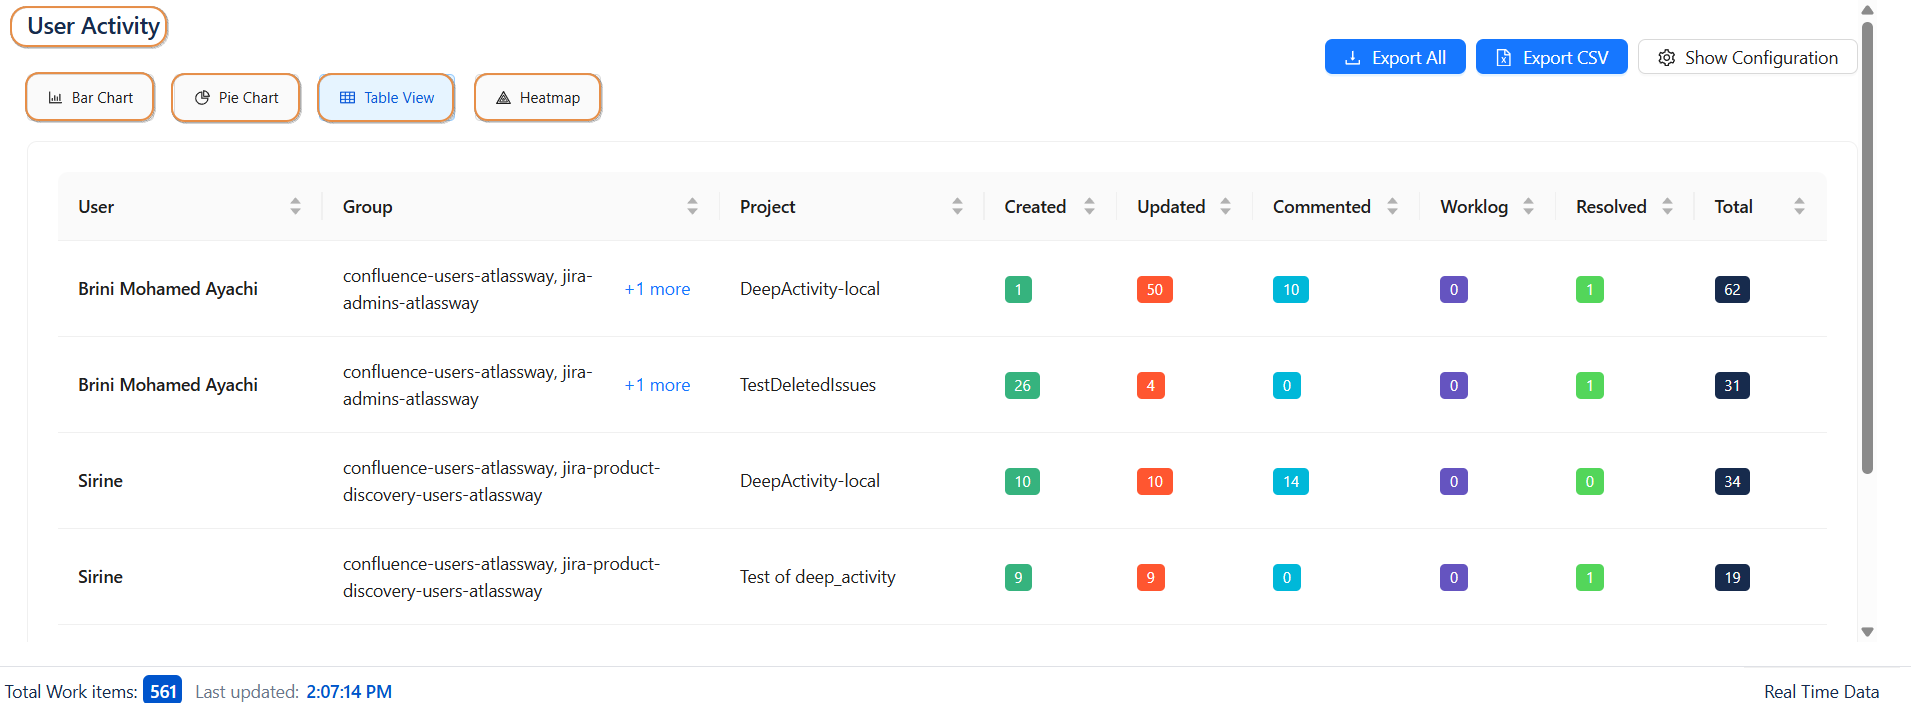
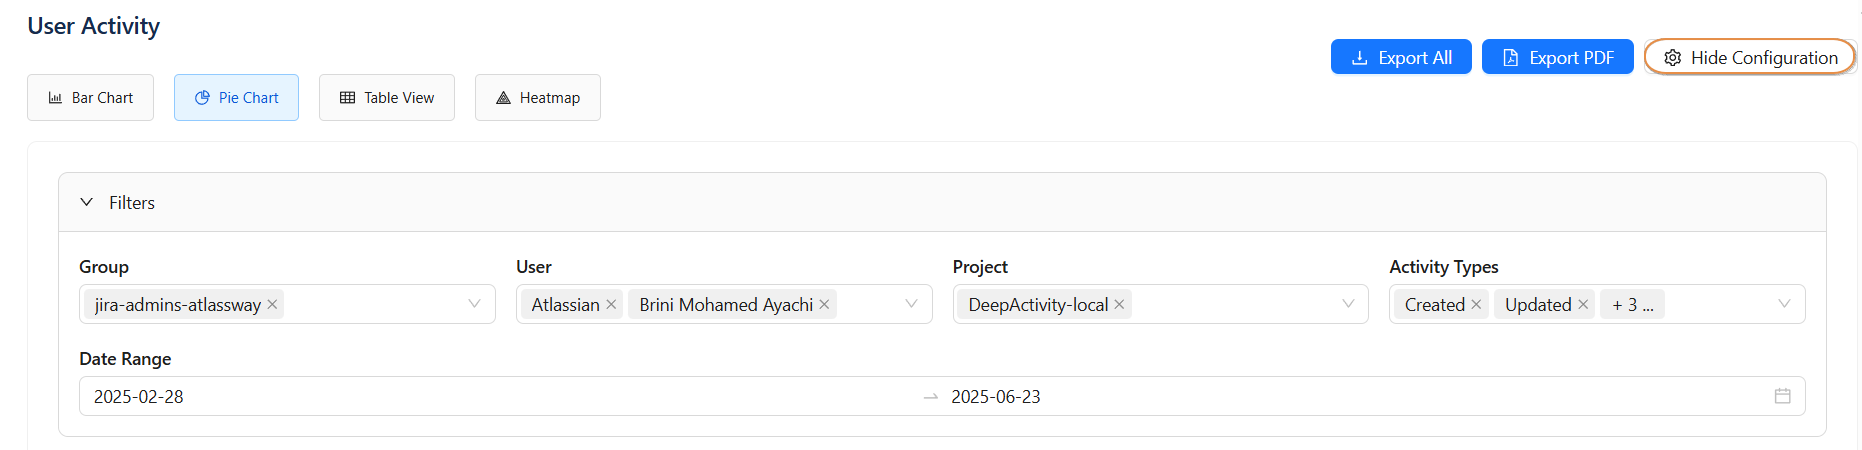
Configuration Options
When you click the Show Configuration button, a set of filters will appear, allowing you to customize the report according to your needs. Once configured, you can hide the configuration panel to get a clearer view of the displayed report.
Available Filters
-
Group
-
User
-
Project
-
Activity Types
-
Date Range
Table Customization
-
Select which columns to display
Export Options
You can export your data in various formats depending on your needs:
-
Export All: Export all available charts in a single action.
-
Export PDF: Export selected views in either PDF format.
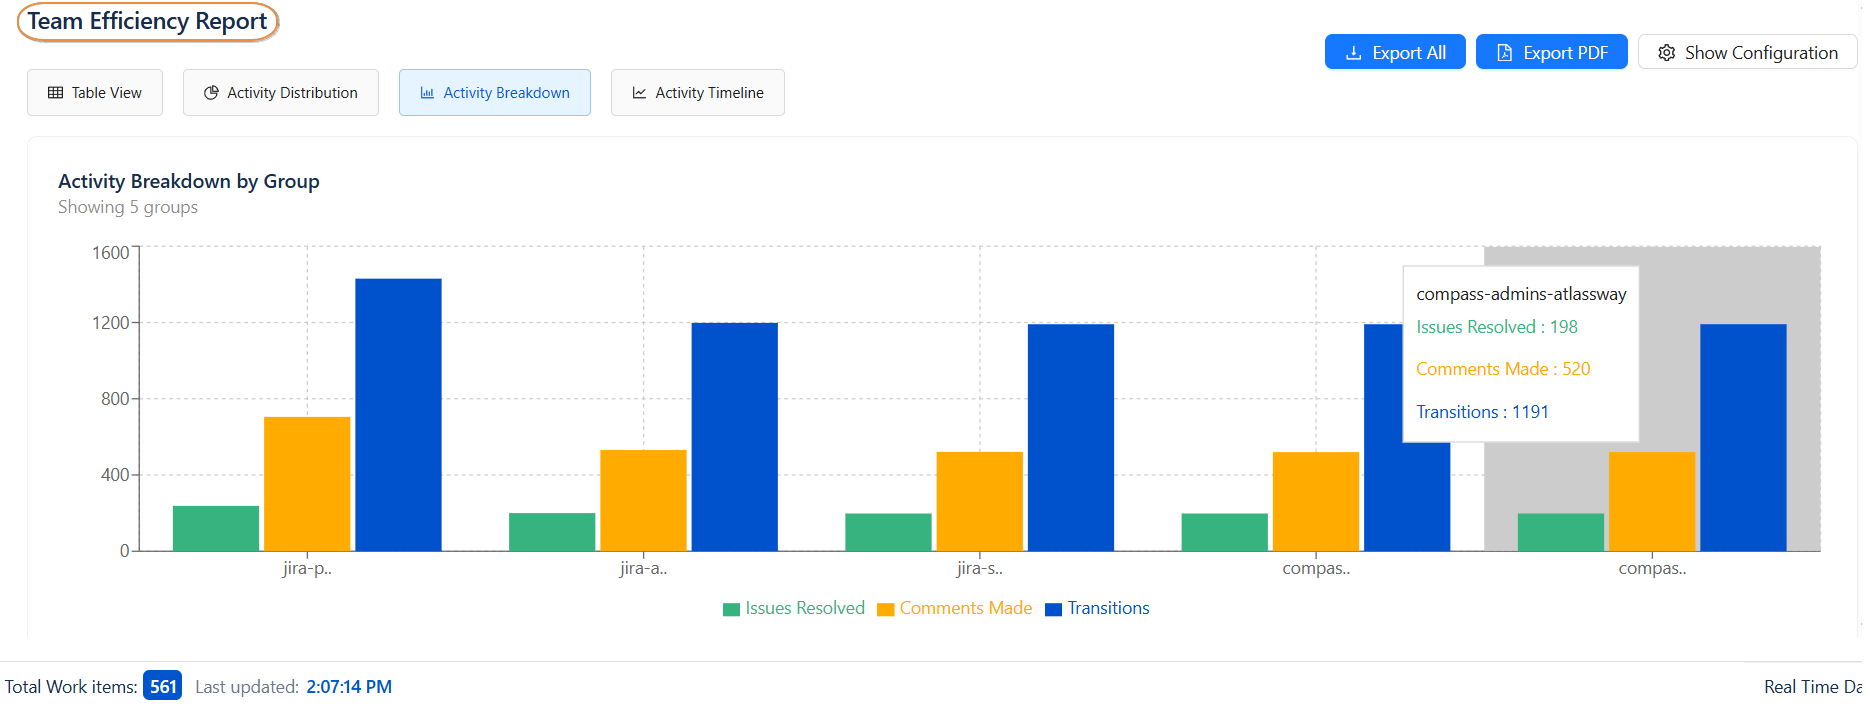
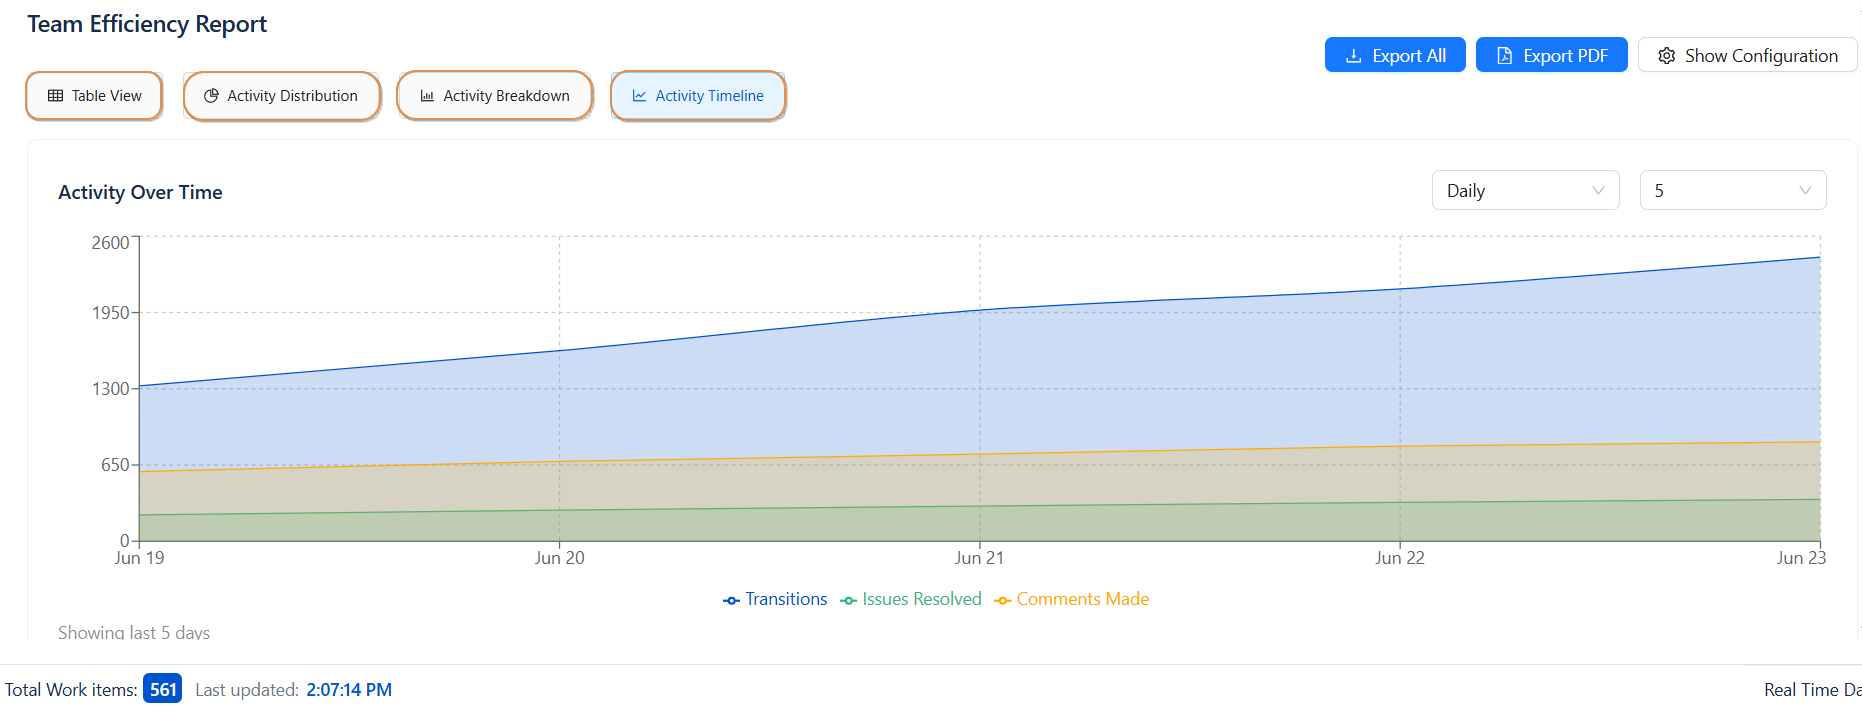
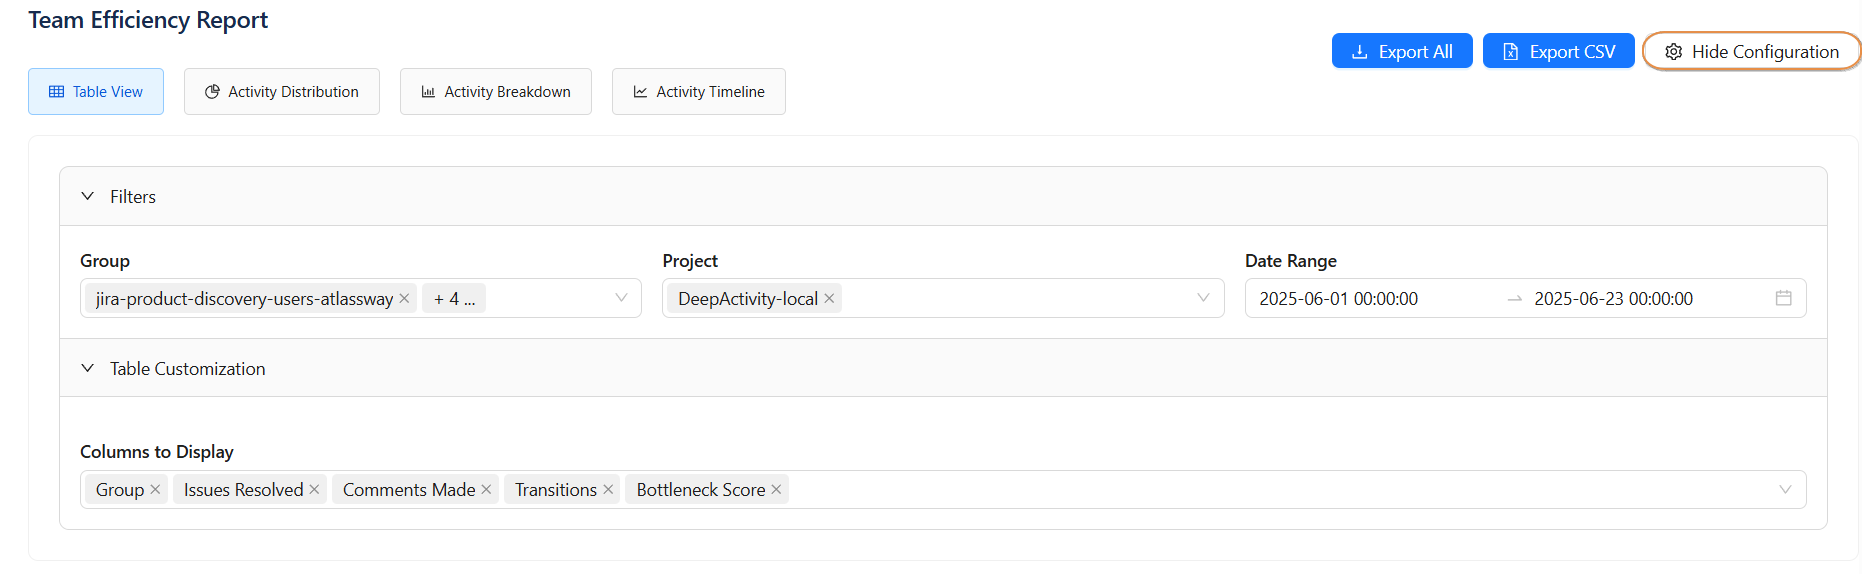
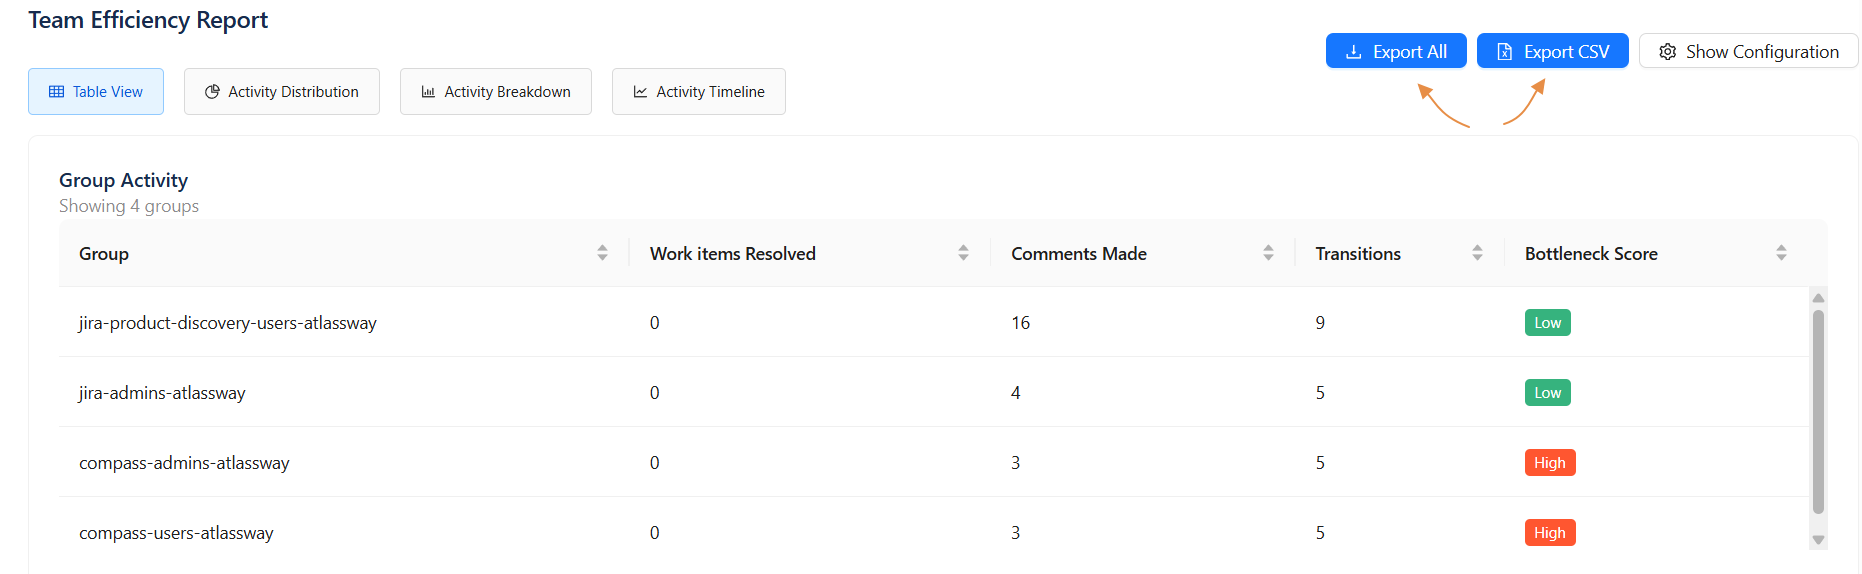
Team Activity Report
-
This report allows teams to evaluate overall team dynamics, productivity, and activity breakdown. It provides clarity on how different groups contribute to project workflows.
Views Available
-
Table View — Displays summarized tabular data for easy reference and export.
Ideal for reviewing structured information and performing custom analysis. -
Activity Distribution — Visual representation of the proportion of different activity types.
Helps understand how effort is divided across various actions (e.g., updates, transitions, comments). -
Activity Breakdown — Detailed view of activity distribution across groups.
Useful for comparing performance and engagement between organizational units. -
Activity Timeline — Tracks activities chronologically to show trends over time.
Helps identify progress, bottlenecks, or spikes in activity across a given period.
Configuration Options
When you click the Show Configuration button, a set of filters will appear, allowing you to customize the report according to your needs. Once configured, you can hide the configuration panel to get a clearer view of the displayed report.
Available Filters
-
Group
-
Project
-
Date Range
Table Configuration
Customize the table by adding columns to display
Export Options
You can export your data in various formats depending on your needs:
-
Export All: Export all available charts in a single action.
-
Export PDF: Export selected views in either PDF format.
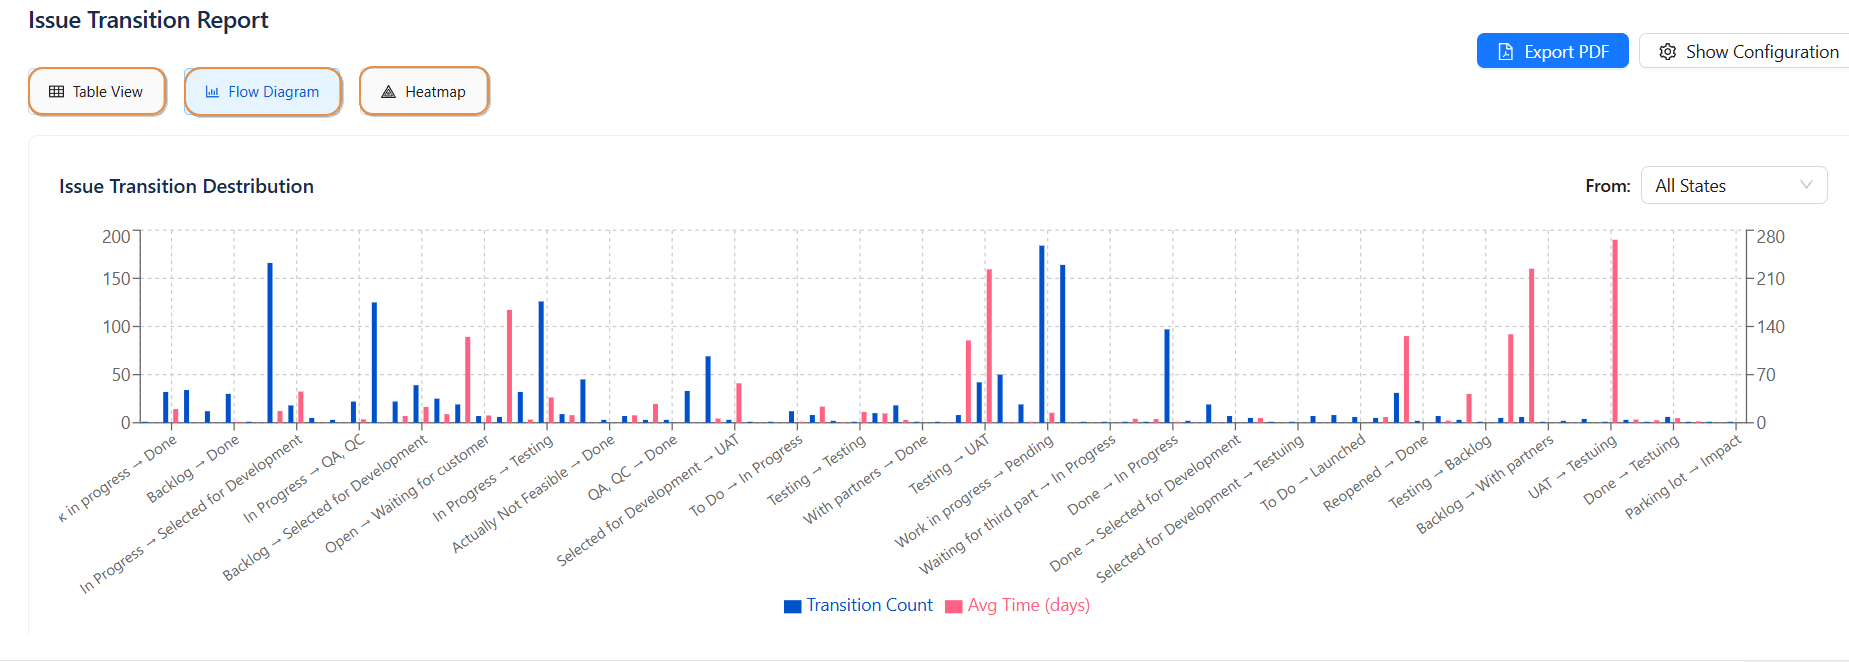
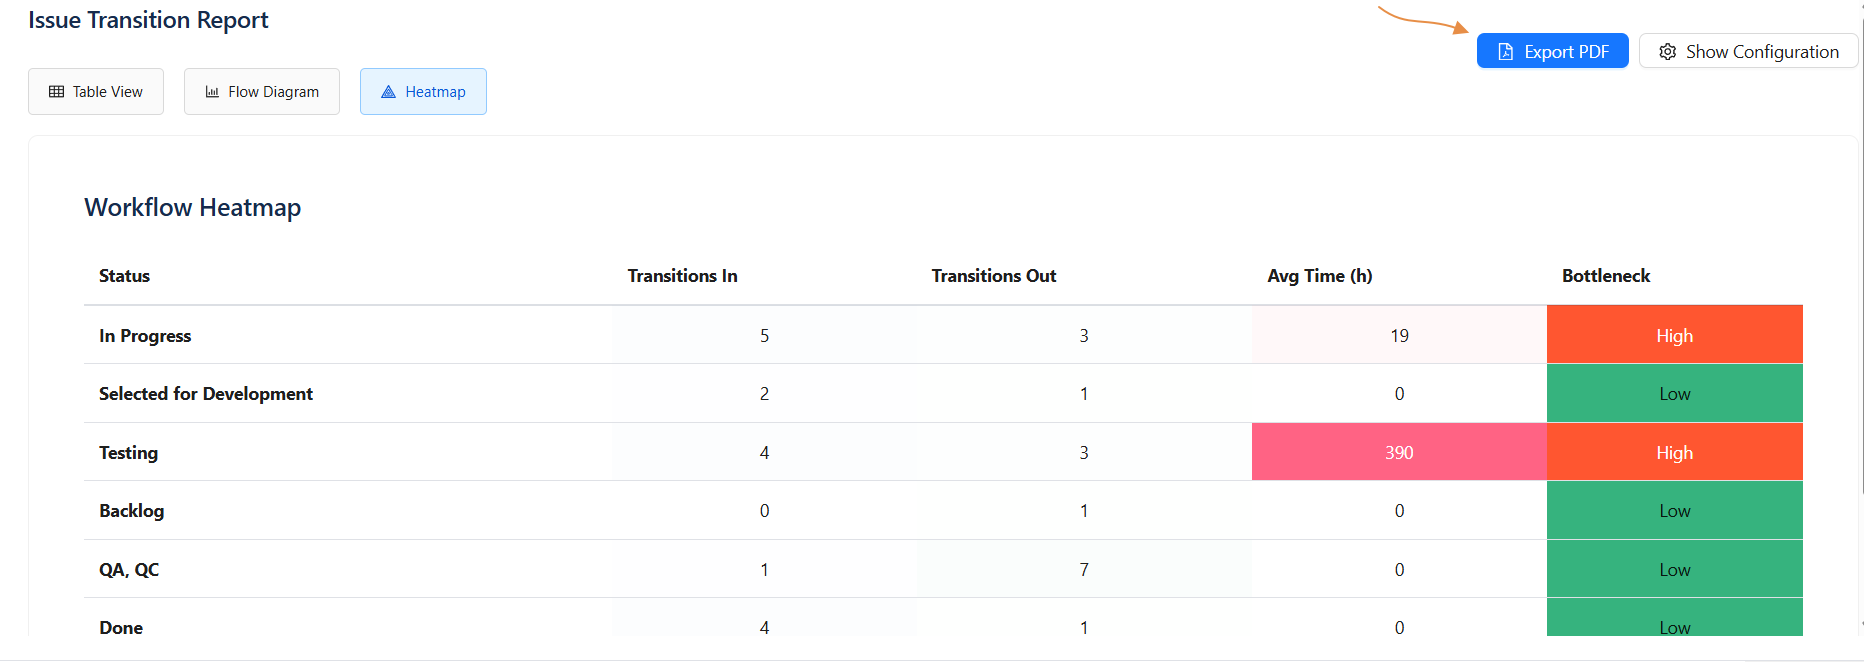
Work Item Transition Report
-
This report allows you to analyze how Work-items flow through different statuses. Useful for identifying process bottlenecks or optimizing transitions.
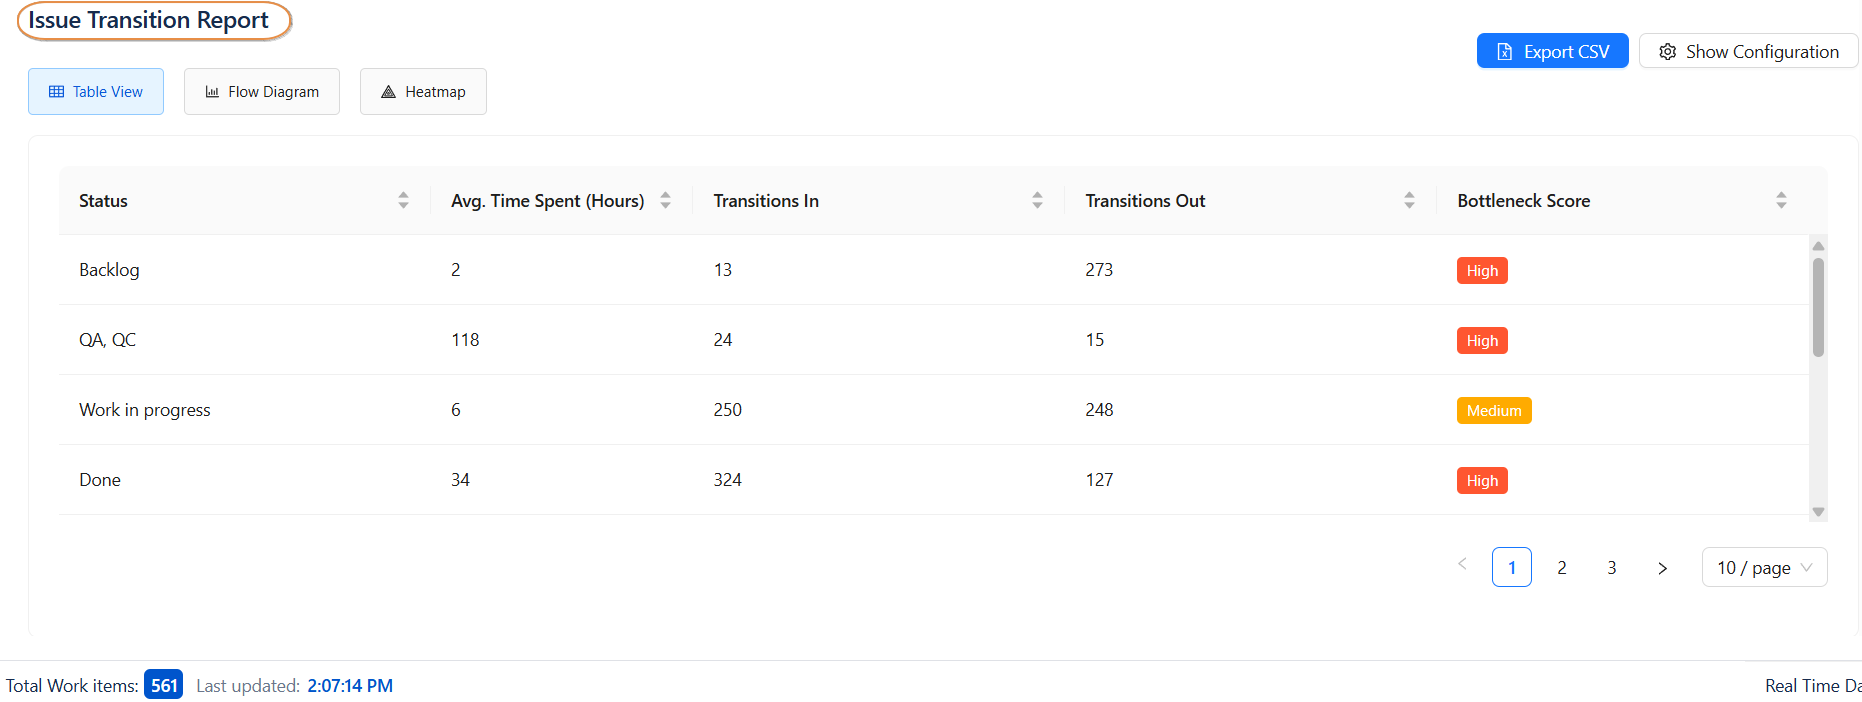
Views Available
-
Table View Displays detailed records of each transition event.
Ideal for tracking individual status changes with timestamps and user actions. -
Flow Diagram Provides a visual representation of how work items move through different statuses.
Helps identify workflow patterns, common paths, and potential bottlenecks. -
Heatmap Shows the intensity and frequency of transitions over time (by day and hour).
Useful for spotting trends, peak workflow periods, and transition delays.
Configuration Options
When you click the Show Configuration button, a set of filters will appear, allowing you to customize the report according to your needs. Once configured, you can hide the configuration panel to get a clearer view of the displayed report.
Available Filters
-
Projects
-
Groups
-
Users
-
Date Range
Table Customization
-
Select which columns to display
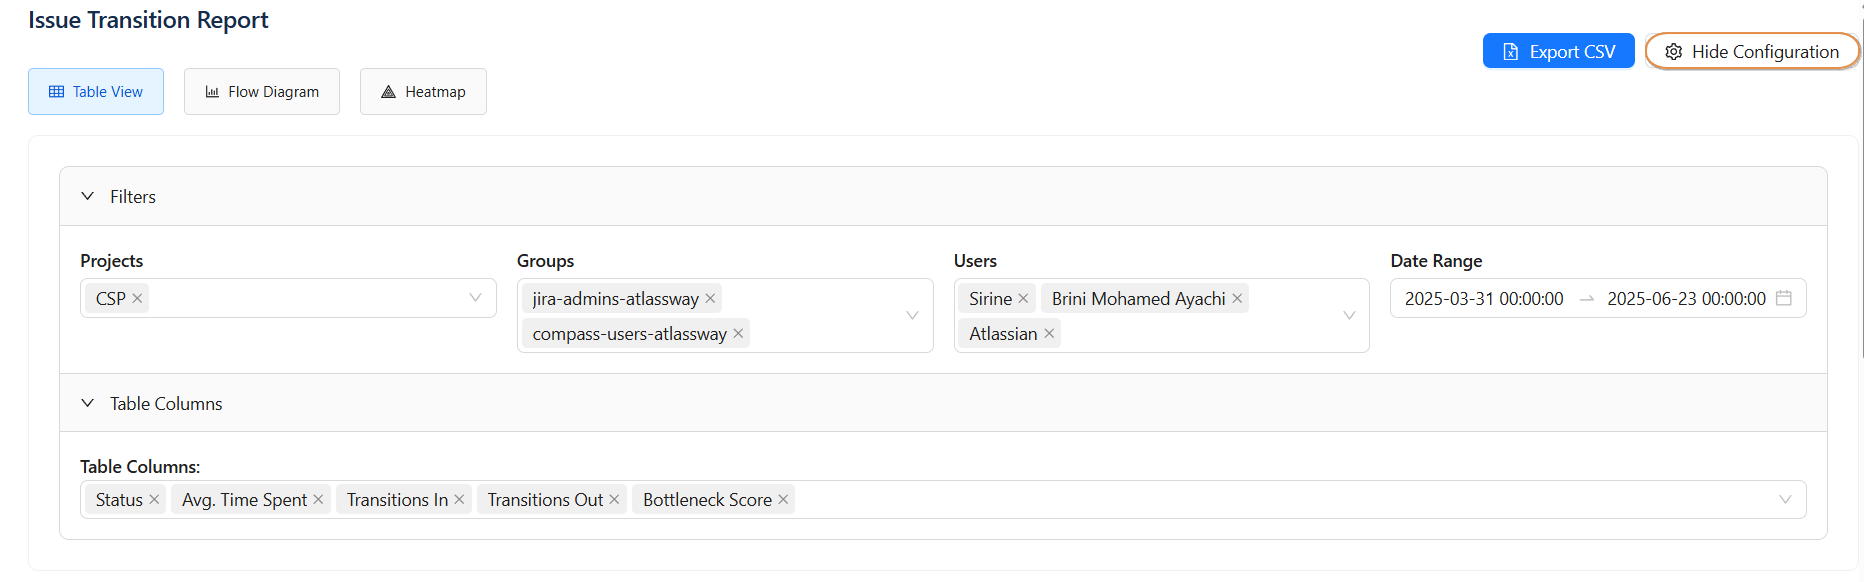
Export Option
You can export your data in :
-
Export PDF: Export selected views in either PDF format.
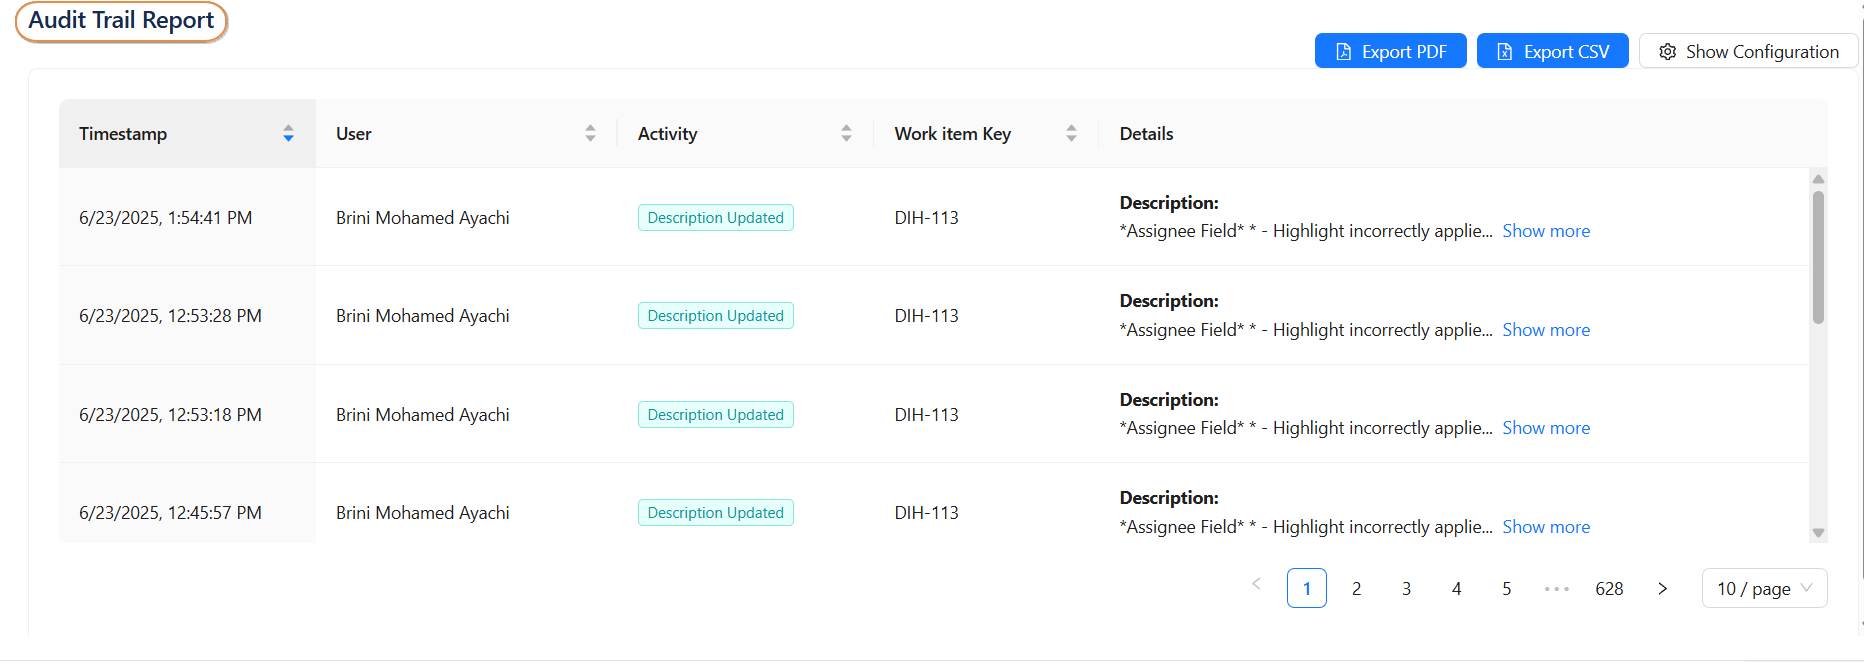
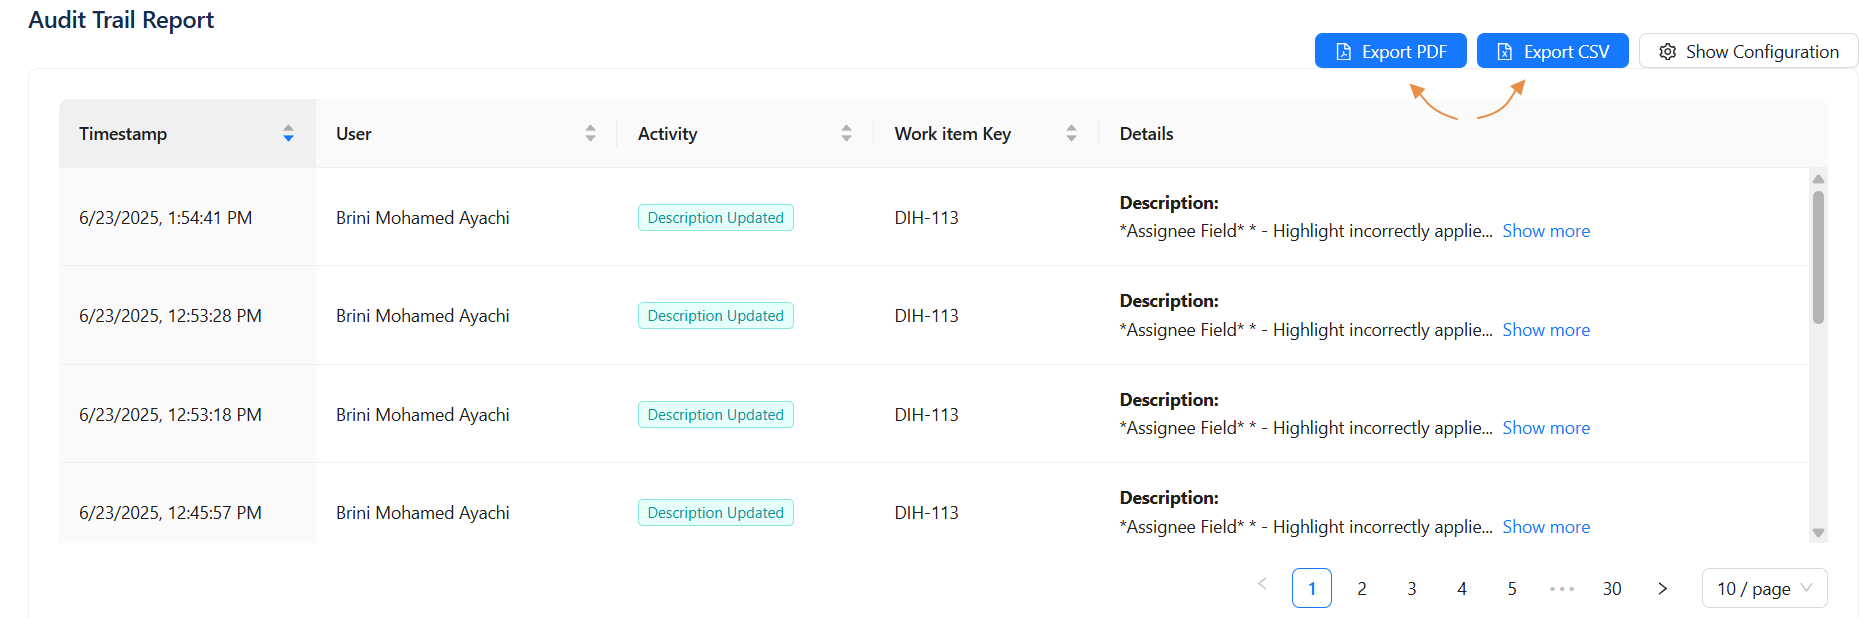
Audit Trail Report
-
An audit trail is a chronological record that logs all user actions and system activities, allowing you to track changes, ensure accountability, and verify data integrity over time.
Configuration Options
When you click the Show Configuration button, a set of filters will appear, allowing you to customize the report according to your needs. Once configured, you can hide the configuration panel to get a clearer view of the displayed report.
Available Filters
-
Date Range
-
Group
-
User
-
Project
-
Activity Type
Table Customization
-
Select which columns to display
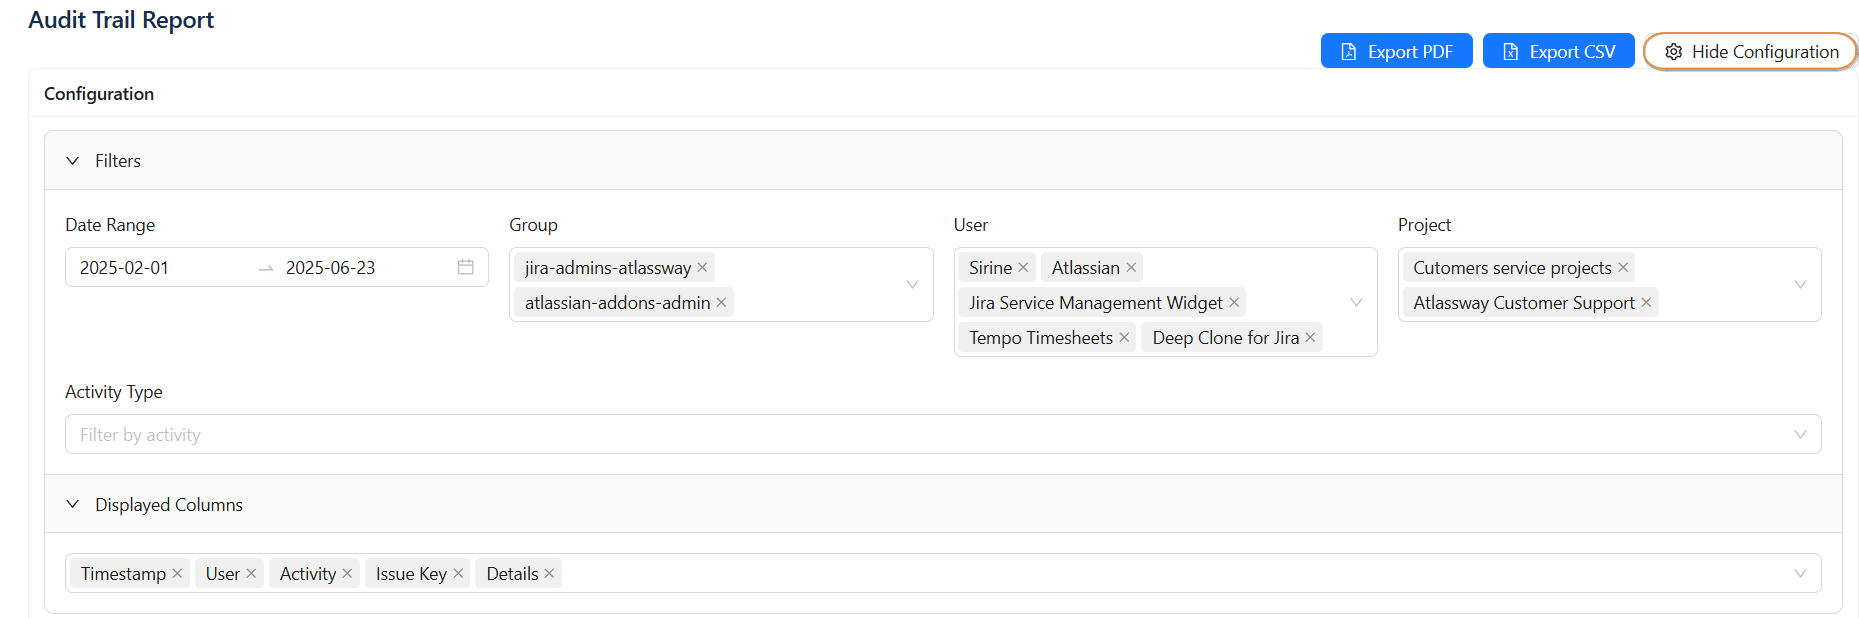
Export Options
You can export your data in various formats depending on your needs:
-
Export CSV: Export selected views in either CSV format.
-
Export PDF: Export selected views in either PDF format.
Worklog Analysis Report
-
Analyze logged work across teams, users, or projects to measure efforts, track performance, and optimize resource allocation.
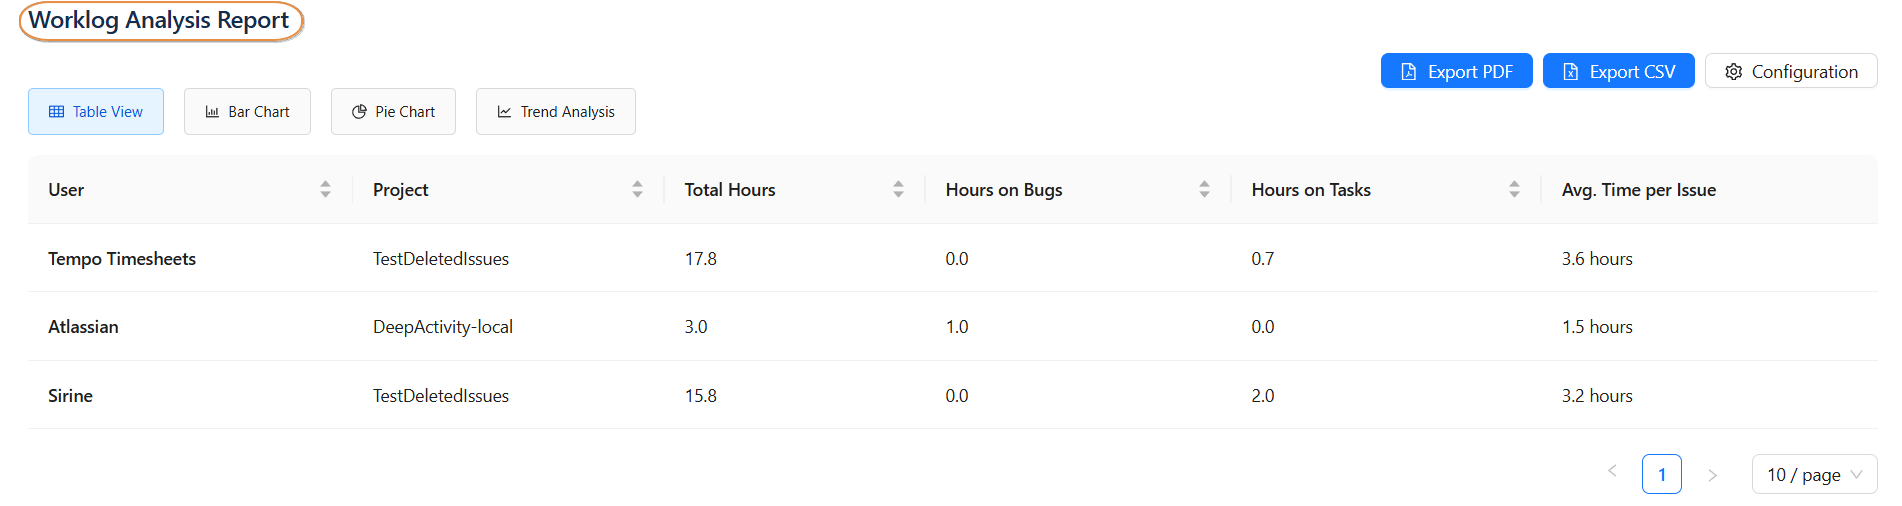
Views Available
-
Table View Displays individual worklog entries with details such as user, time spent, and date.
Useful for reviewing raw time-tracking data. -
Bar Chart Visualizes the total effort logged per user or task.
Ideal for comparing contributions across individuals or projects. -
Pie Chart Shows the share of logged work by user or category.
Helps illustrate how effort is distributed across the team. -
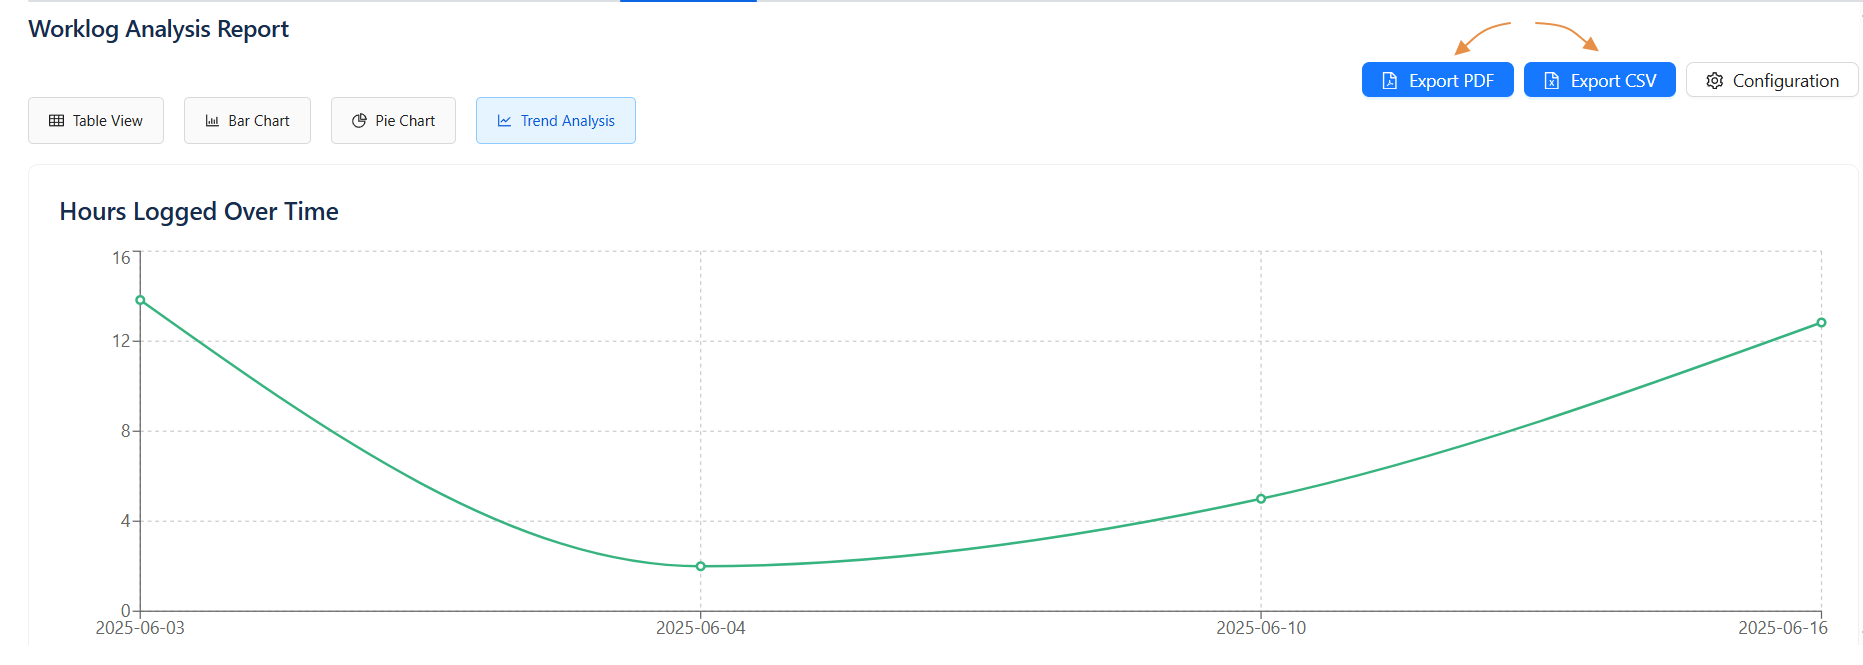
Trend Analysis Tracks effort logged over time to identify patterns or changes in workload.
Great for monitoring productivity trends and forecasting future capacity.
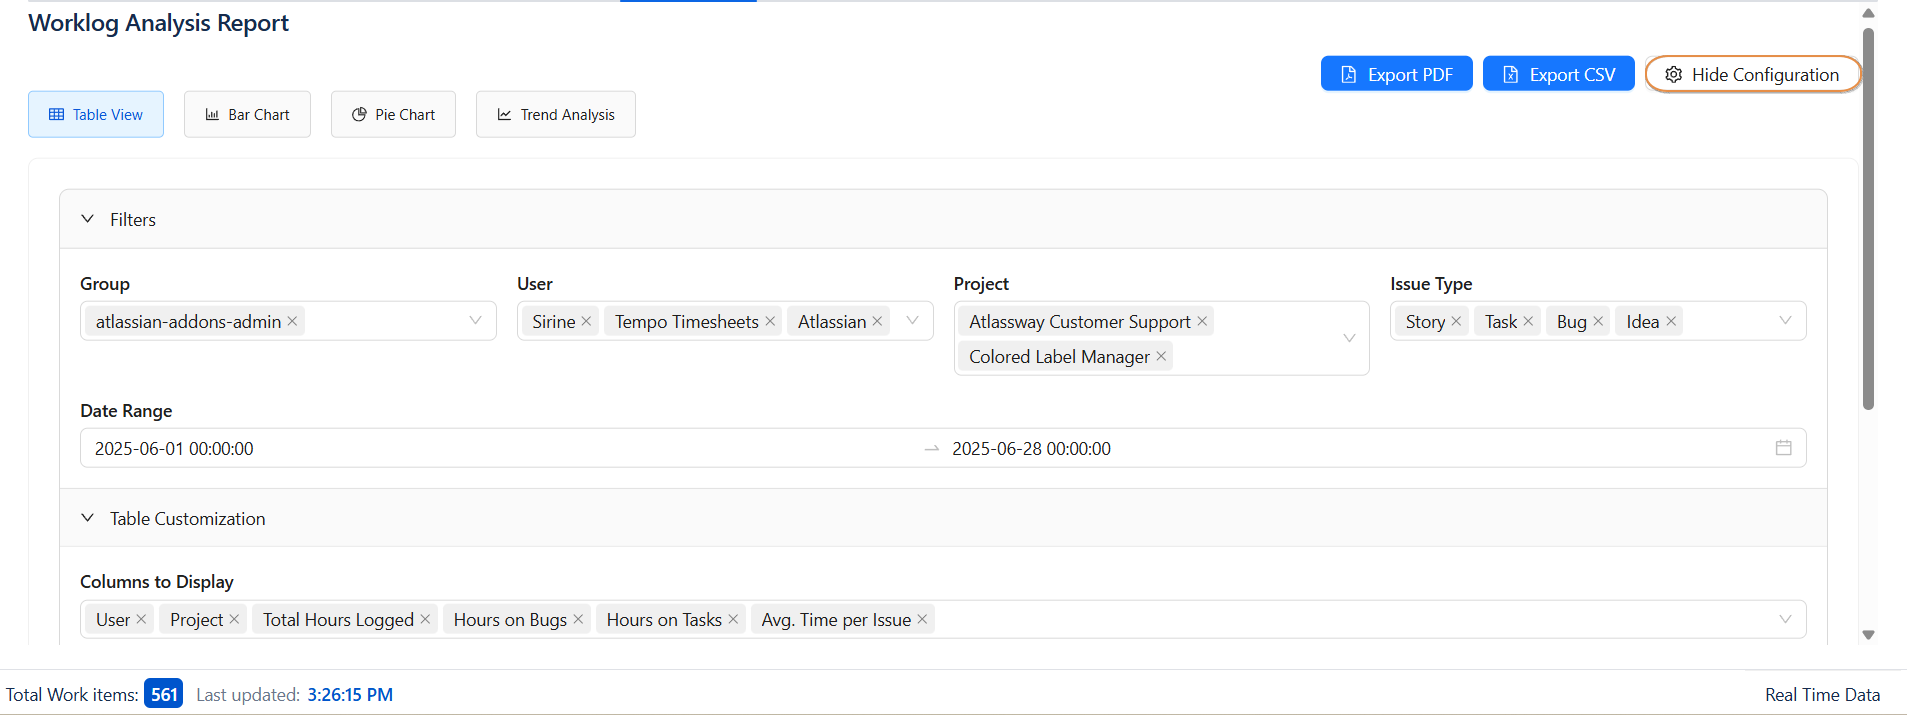
Configuration Options
When you click the Show Configuration button, a set of filters will appear, allowing you to customize the report according to your needs. Once configured, you can hide the configuration panel to get a clearer view of the displayed report.
Available Filters
-
Group
-
User
-
Project
-
Work-item Type
-
Date Range
Table Customization
-
Select which columns to display
Export Options
You can export your data in various formats depending on your needs:
-
Export CSV: Export selected views in either CSV format.
-
Export PDF: Export selected views in either PDF format.
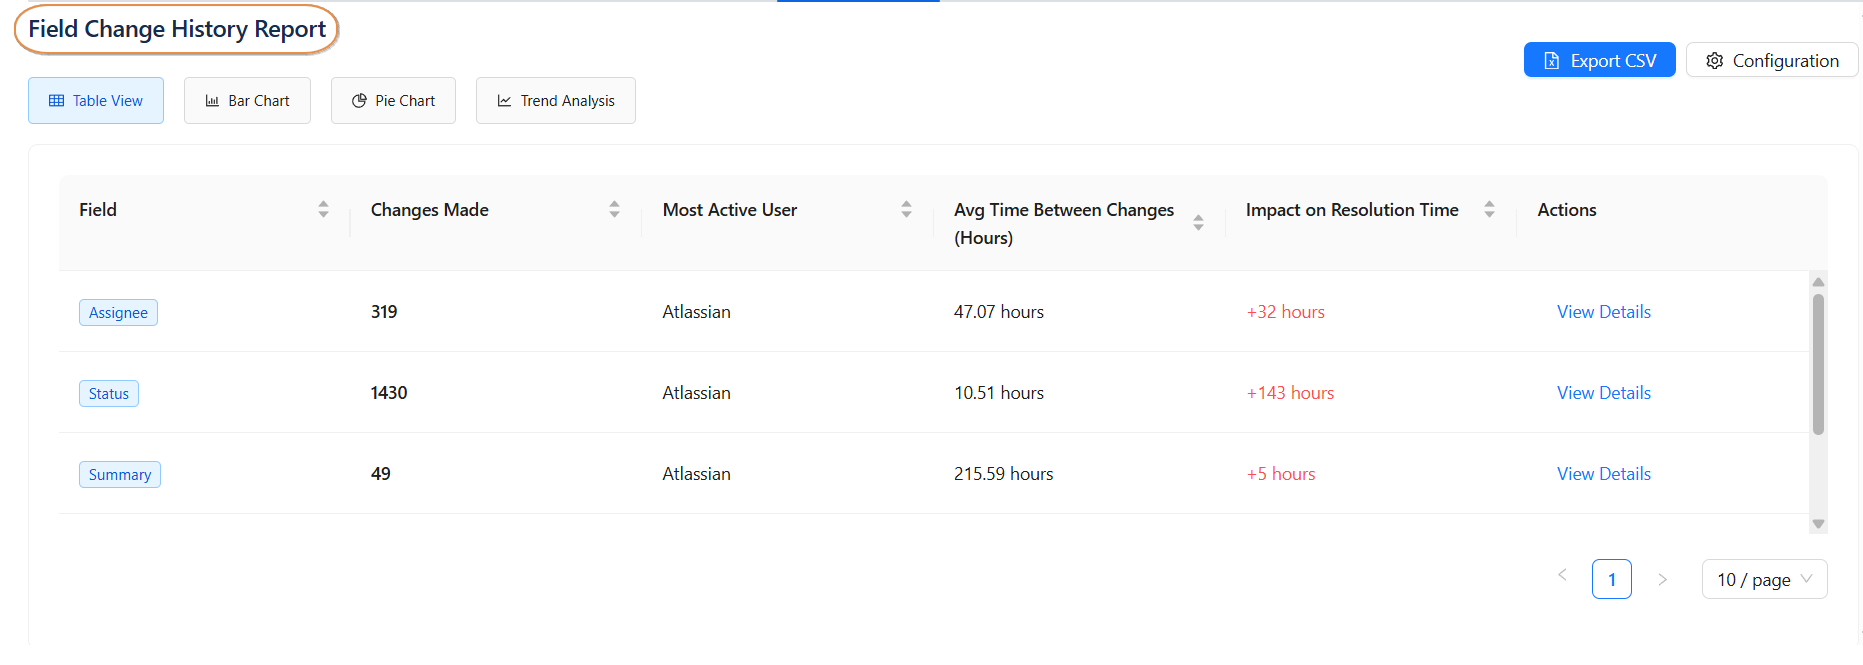
Field Change History Report
-
Track historical changes made to Work-item fields. Perfect for change tracking and accountability.
Views Available
-
Table View — Displays all field change entries, including the original and updated values, user, and timestamp.
Ideal for auditing changes and understanding data evolution. -
Bar Chart Shows the volume of field changes by user, field, or Work-item.
Helps identify who made the most changes or which fields are most frequently updated. -
Pie Chart Illustrates the proportion of changes made to each field.
Useful for visualizing which fields are most impacted during updates. -
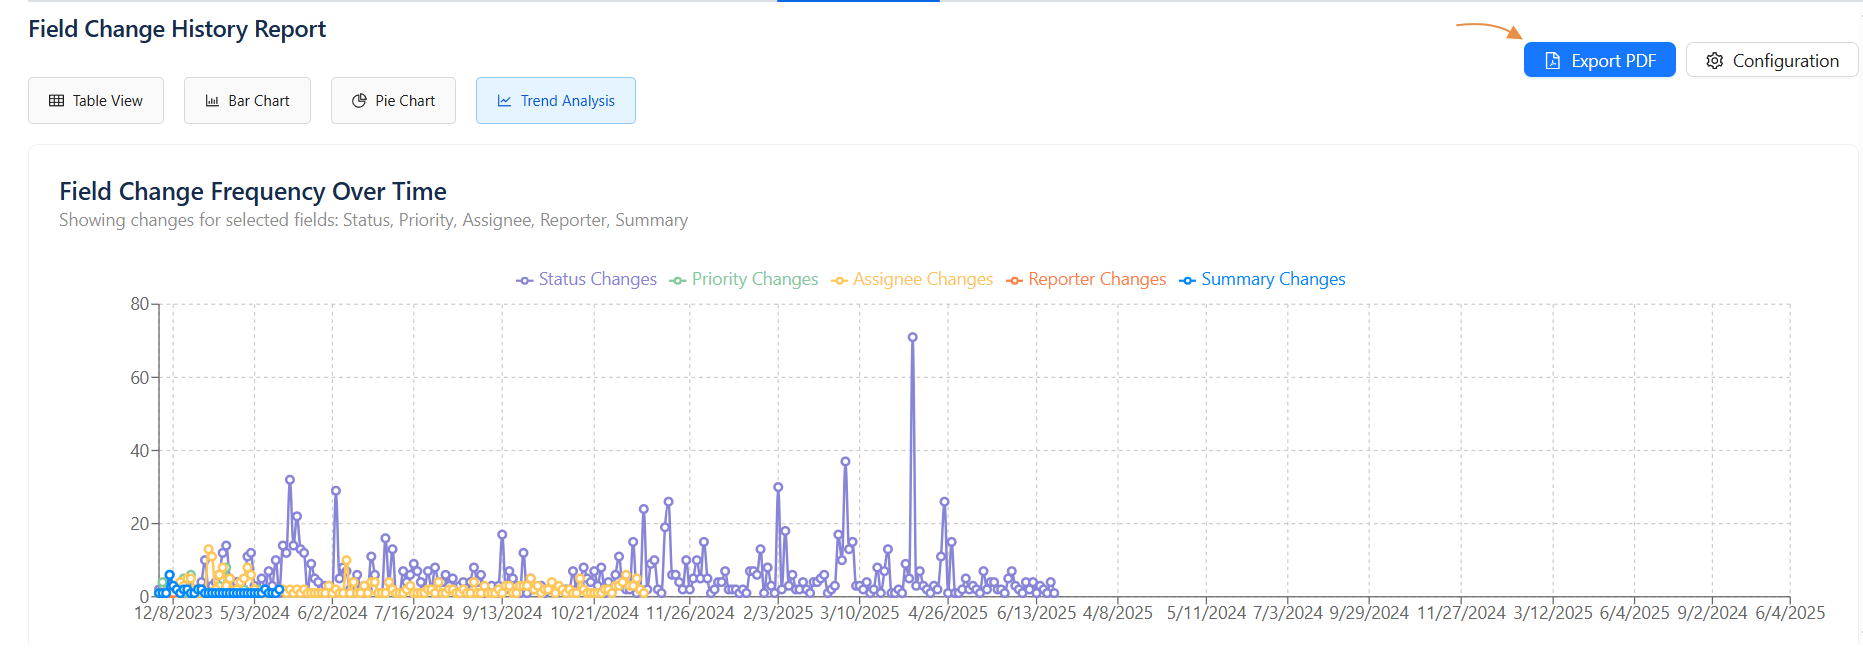
Trend Analysis Tracks field changes over time to reveal activity spikes or long-term trends.
Enables better monitoring of update behavior across a defined period.
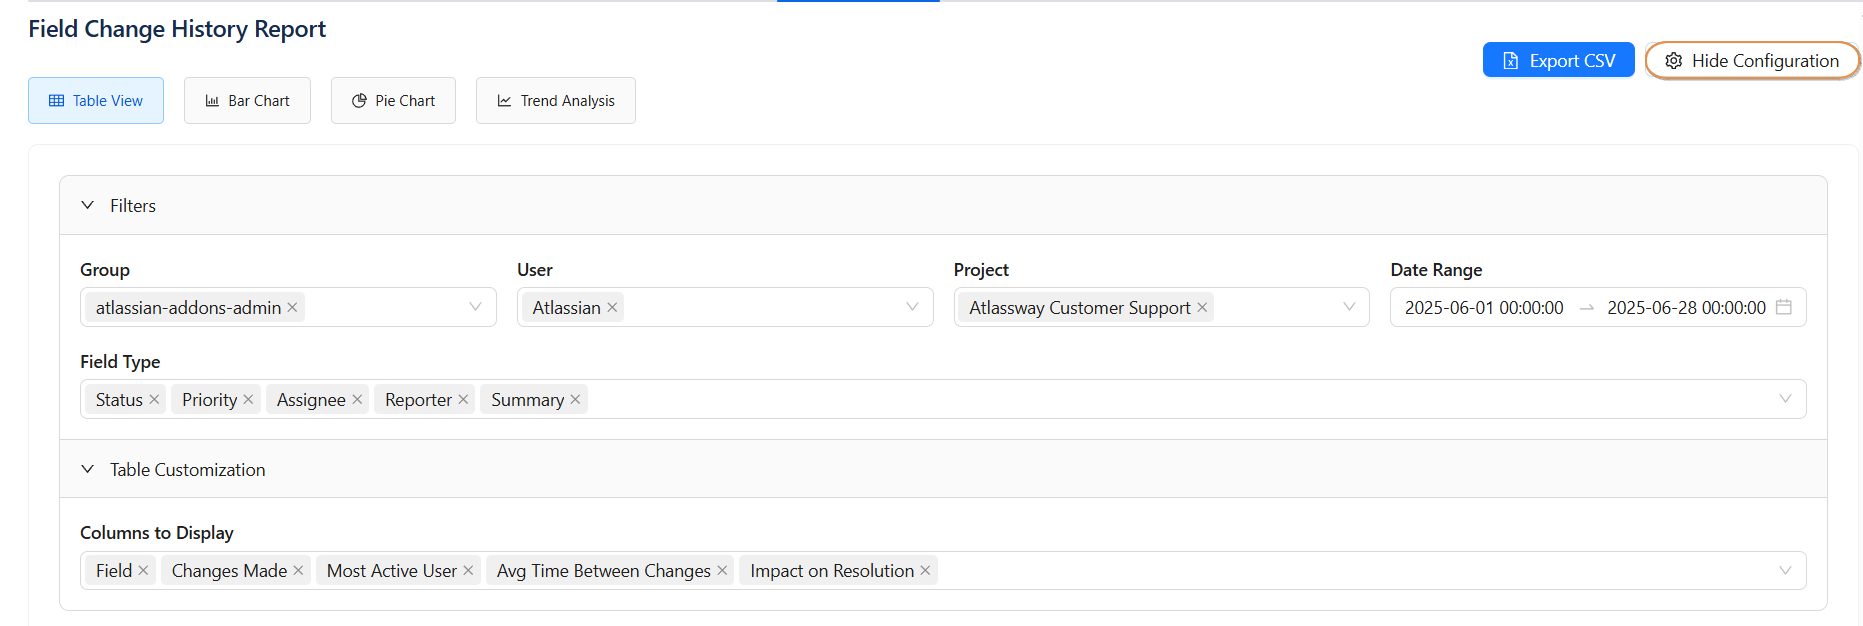
Configuration Options
When you click the Show Configuration button, a set of filters will appear, allowing you to customize the report according to your needs. Once configured, you can hide the configuration panel to get a clearer view of the displayed report.
Available Filters
-
Group
-
User
-
Project
-
Date Range
-
Field Type
Table Customization
-
Select which columns to display
Export Options
You can export your data in
-
Export PDF: Export selected views in either PDF format.
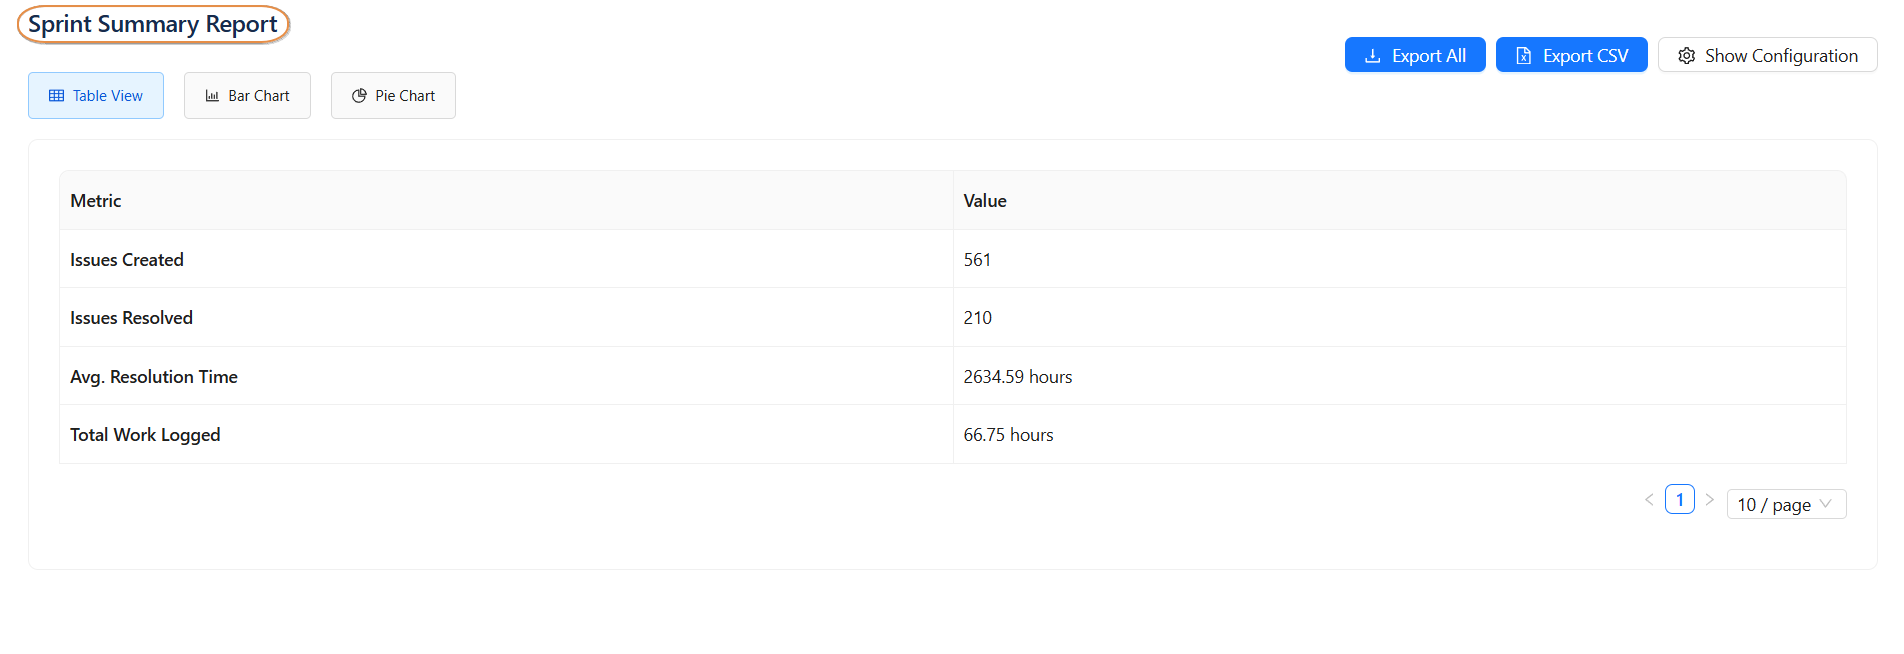
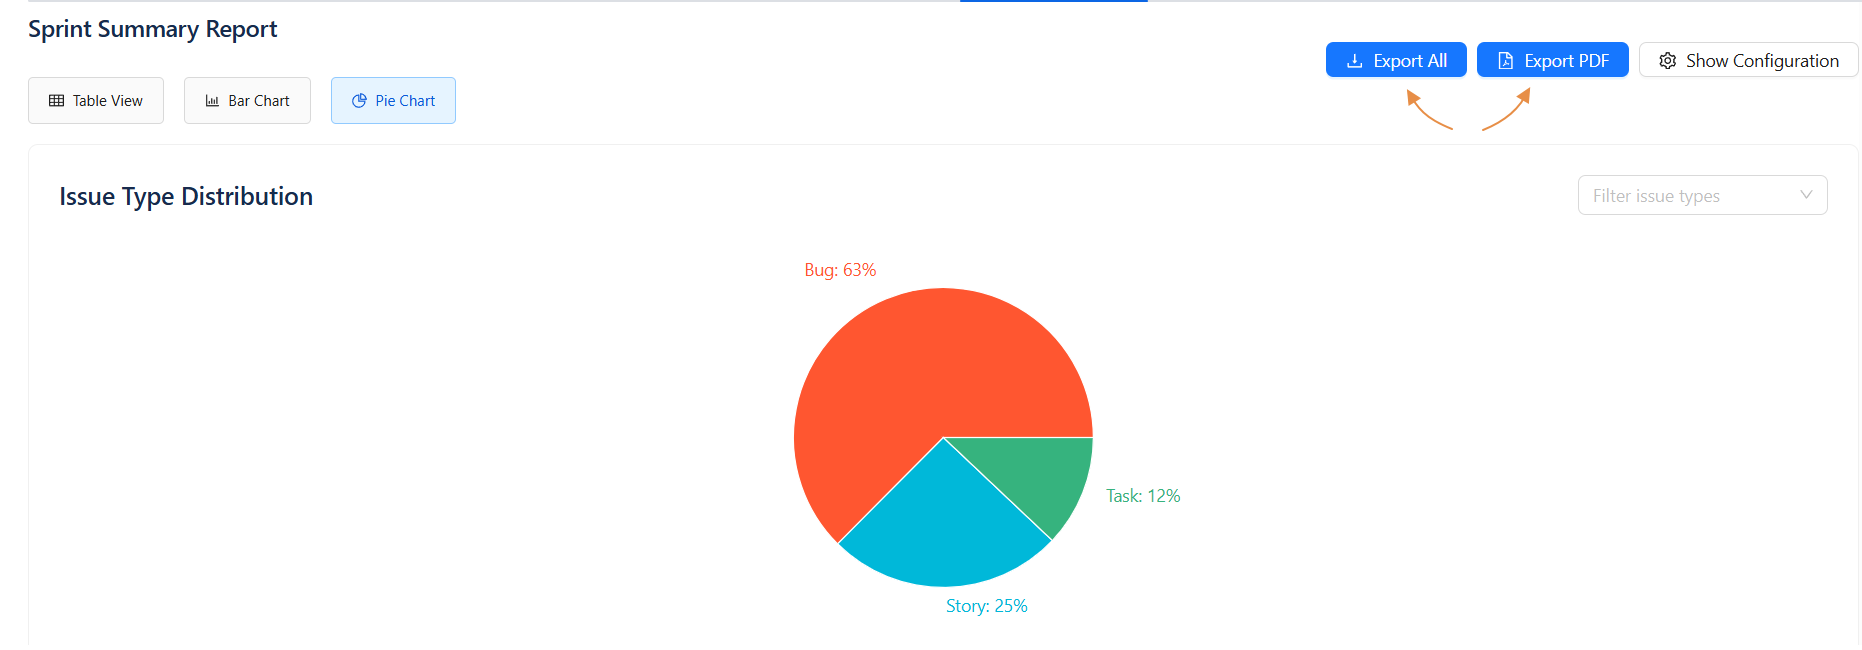
Sprint Summary Report
-
Summarizes sprint performance and Work-item statuses. Useful for retrospective meetings or sprint planning.
Views Available
-
Table View Displays sprint summaries, including key metrics such as total Work-items, completed work, and remaining tasks.
Useful for reviewing overall sprint performance at a glance. -
Bar Chart Visualizes the distribution of tasks by status (e.g., To Do, In Progress, Done).
Helps assess progress and identify workload balance within the sprint. -
Pie Chart Shows the proportion of tasks by type or status.
Ideal for understanding the composition of work items in a sprint.
Configuration Options
When you click the Show Configuration button, a set of filters will appear, allowing you to customize the report according to your needs. Once configured, you can hide the configuration panel to get a clearer view of the displayed report.
Available Filters
-
Sprint
-
Project
-
Date Range
Metric Customization
-
Select which Metrics to Display
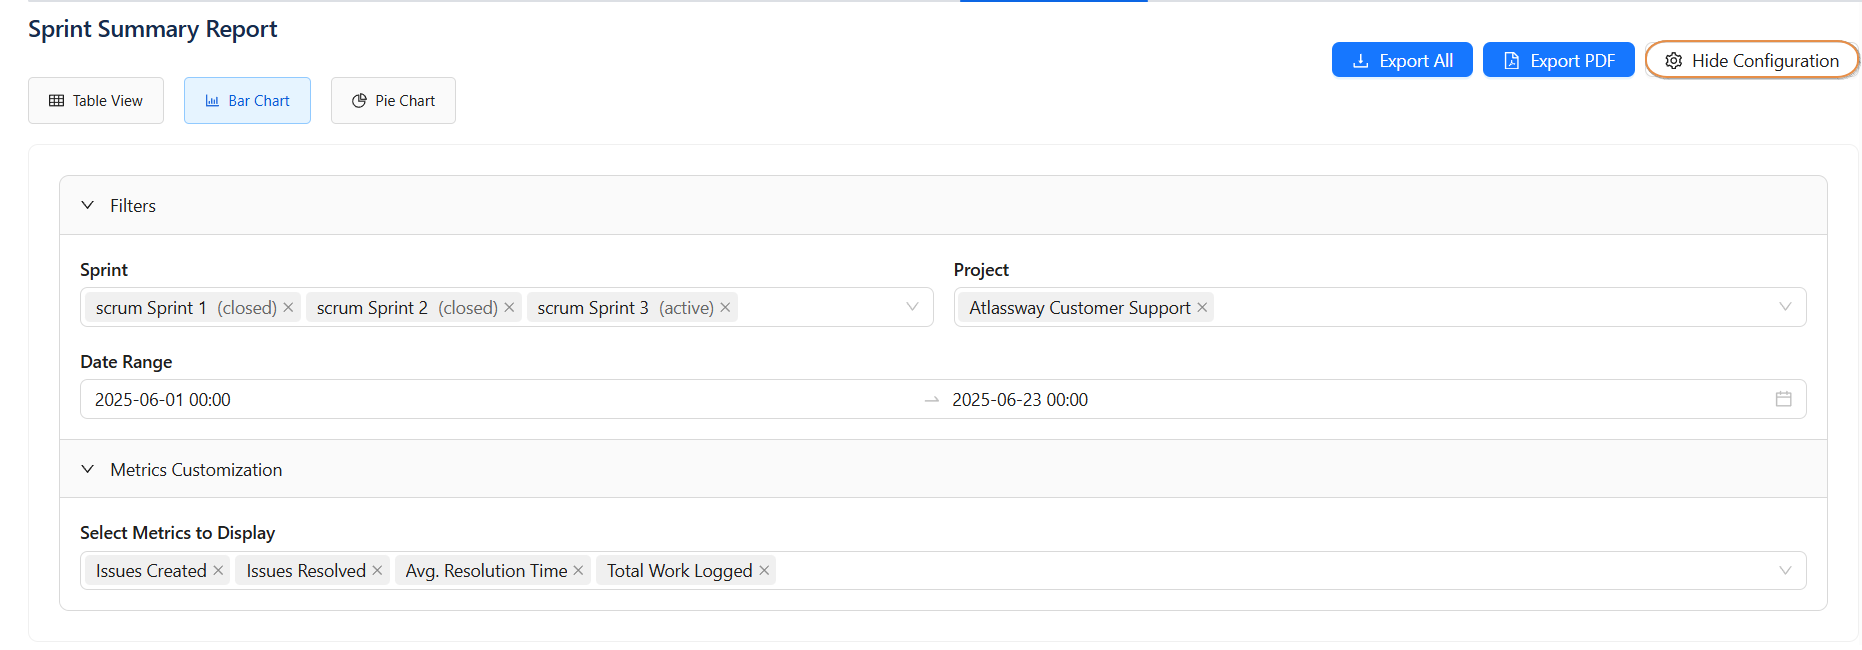
Export Options
You can export your data in various formats depending on your needs:
-
Export All: Export all available charts in a single action.
-
Export PDF: Export selected views in either PDF format.
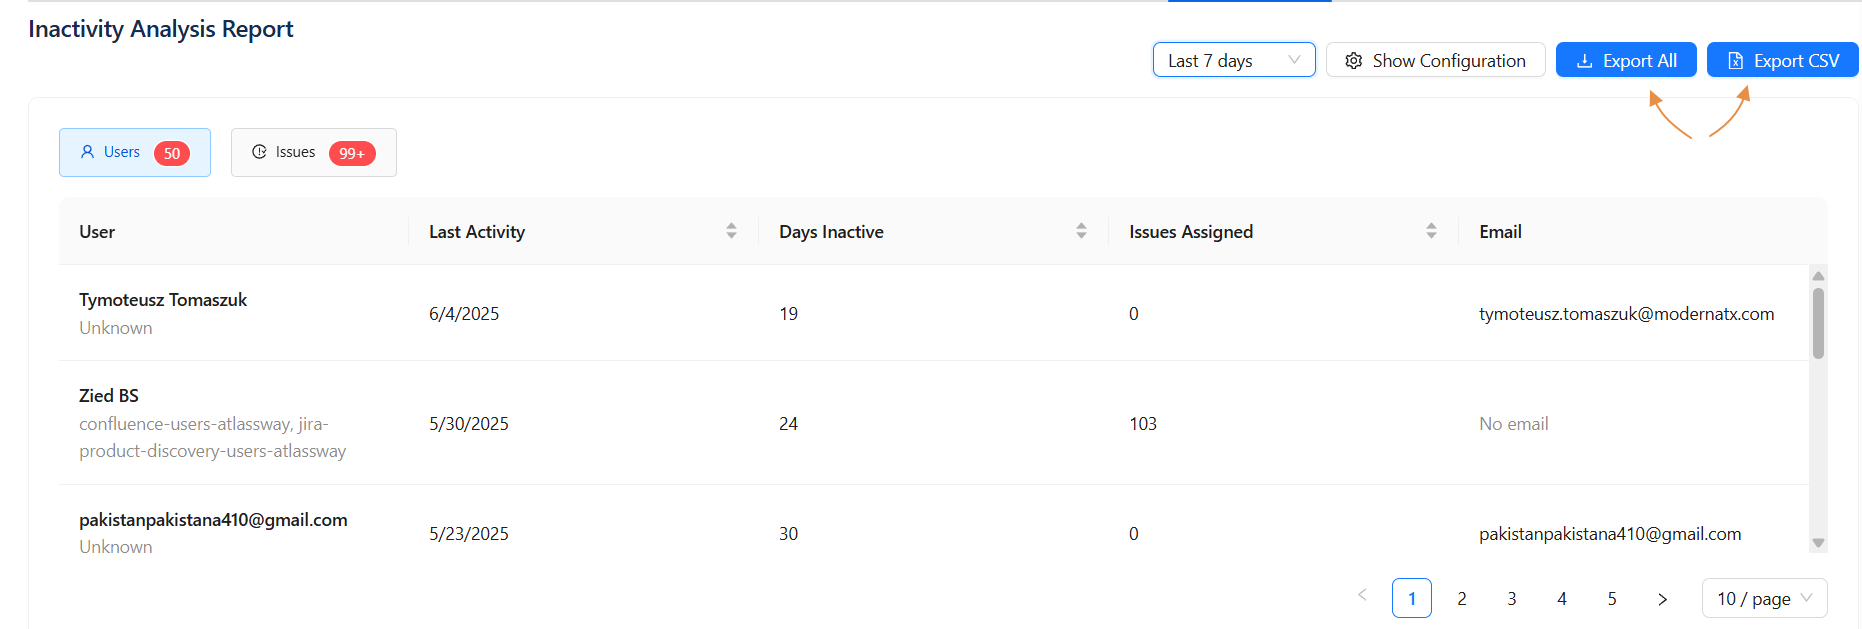
Inactivity Analysis Report
-
Identify inactive users or Work-items based on no activity during a selected period.
-
Supports proactive follow-ups and clean-up.
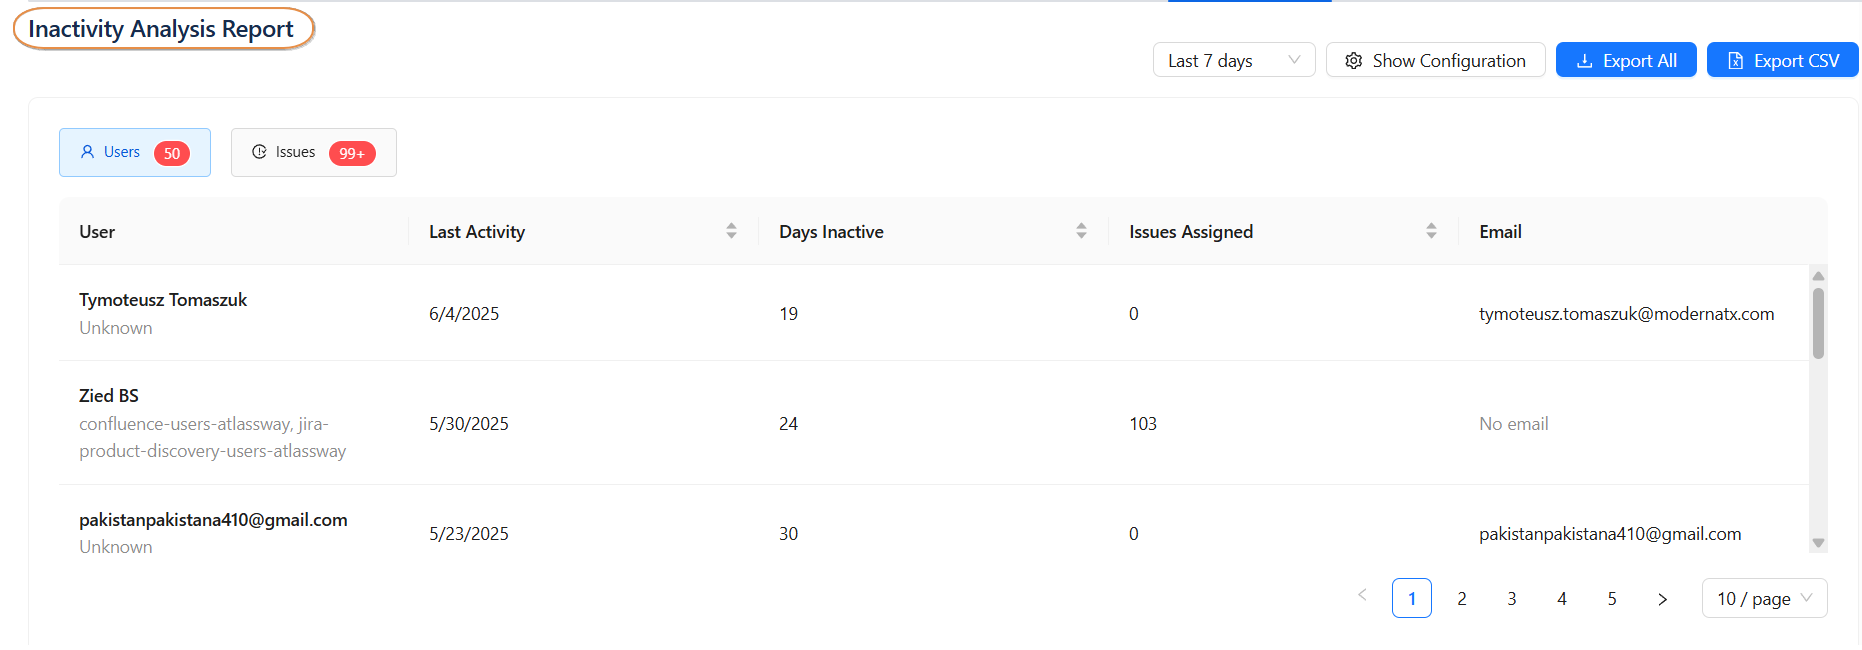
Available Views
-
Users
Refers to system users who have not performed any tracked activity such as updating, commenting, or transitioning work items within the selected time frame (the past 7 days). -
This helps identify inactive or disengaged team members.
-
Work Items
Represents Work-items or tasks (bugs, stories, tasks) that have had no updates, transitions, or other activity during the specified period. These inactive items may indicate blocked work or forgotten tasks.
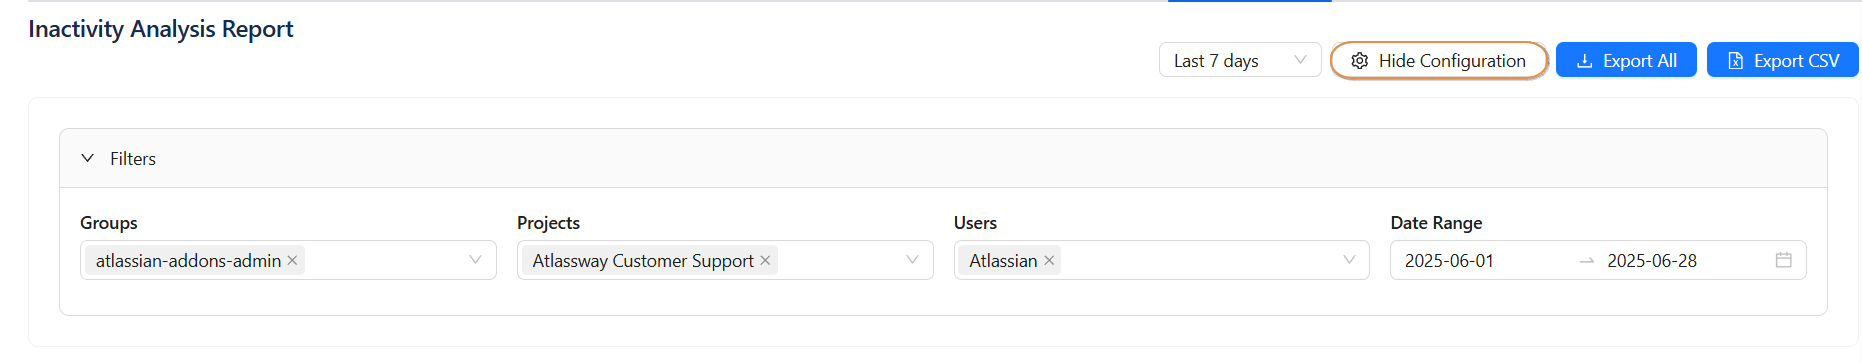
Configuration Options
When you click the Show Configuration button, a set of filters will appear, allowing you to customize the report according to your needs. Once configured, you can hide the configuration panel to get a clearer view of the displayed report.
Available Filters
-
Group
-
User
-
Project
-
Date Range
Export Options
You can export your data in various formats depending on your needs:
-
Export All: Export all available charts in a single action.
-
Export PDF: Export selected views in either PDF format.
Need Help!
🤝 We're here for you! If you have any questions, suggestions, or feature requests, feel free to reach out — we typically respond within 4 hours.