
Time in Status for Work Items — One-Page Guide (Jira Cloud)
Overview
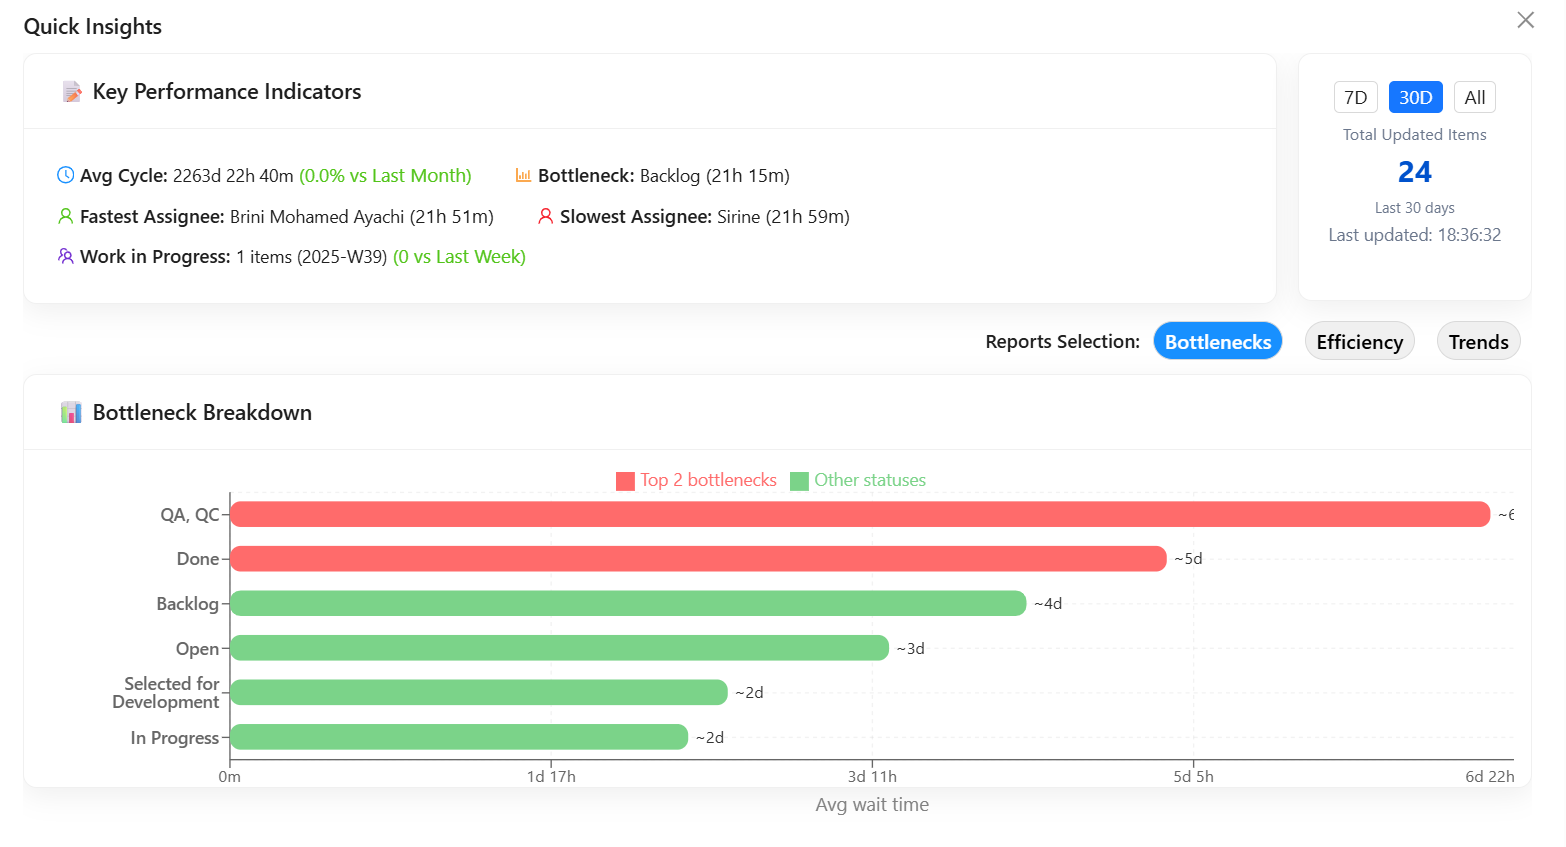
Time in Status for Work Items turns Jira change history into clear, shareable insights without sending data outside Atlassian (zero data egress, Forge-hosted). Measure how long work items spend in each status or with each assignee, analyze transitions, spot bottlenecks, and add gadgets to dashboards.
Works with: Jira Software & Jira Service Management (Cloud)
Permissions:Respects Jira permissions : users only see work items they can view.
Key capabilities
-
⏱️ Time in Status, Time with Assignee, Average Time, Time Between Statuses
-
🔁 Transition analytics: counts, dates, first/last to/from status or assignee
-
📆 Trends: daily/weekly/monthly, with median & 85th percentile
-
🚨 Recently stuck highlights to surface bottlenecks quickly
-
🧩 Combinations: Time in Status per Assignee; Time with Assignee per Status
-
🧮 Status grouping for Cycle Time & Lead Time
-
🗓️ Business hours & holidays, site timezone; optional re-entries aggregation
-
💾 Saved views, column manager, CSV/Excel export
-
📊 Dashboard gadgets for multi-report views
Install & first run
-
Install from Atlassian Marketplace (admin).
-
Open Apps → Colored Time in Status for Work Items.
-
Scope your data (Project/Board/JQL).
-
Choose a Report Type and Time Grain (Daily/Weekly/Monthly).
-
Click Save View to reuse; add to a dashboard via gadgets.
Reports you can run
-
Time in Status / Per Time Grain
-
Status Count; Average Time in Status / Per Time Grain
-
Time Between Status Transitions (e.g., From In Progress → Done)
-
Recent Time in Status (items currently over N hours/days)
-
Time with Assignee / Per Time Grain
-
Assignee Count; Per-Person Status Transitions / Per Time Grain
-
Time with Assignee per Status; Time in Status per Assignee
-
Status Transition Count / Dates / Details (from→to, actor, time)
-
First/Last to/from Assignee/Status
-
Time in Field (duration a custom field value stayed unchanged)
Configuration
-
Time Grain: switch Daily / Weekly (ISO) / Monthly
-
Business Hours: working days & hours; add holidays
-
Status Grouping: create groups (e.g., To Do, In Progress, Done) to compute Cycle/Lead Time
-
Re-entries: count every revisit to the same status (on) or only first pass (off)
-
Columns & Highlights: show/hide fields, set threshold colors for long durations
-
Saved Views: store scope, filters, columns, and highlights; share with your team
Dashboards & sharing
-
Add gadget: Custom Time in Status, one gadget for all reports types.
Finding bottlenecks fast
-
Recently Stuck: filter by “currently in status > N hours/days”
-
Trend changes: compare this week vs. last week; sort by biggest increases
-
Heatmap: Status × Assignee to reveal hotspots
-
Throughput vs. Latency: view Status Count next to Avg Time
Security & data handling
-
🔒 Zero data egress: no external storage; processing runs on Atlassian Forge
-
🔐 Access control: honors Jira permissions and issue security levels
-
🧾 Auditability: metrics are derived from Jira timestamps/change history
Tips & troubleshooting
-
Large data? Start with a narrower JQL (project, label, date range)
-
Empty columns? Ensure the status/assignee appears in history for the scoped items
-
Unexpected timezone? Check site timezone and (if enabled) business-hours calendar
-
Performance: reuse Saved Views in dashboards
Support
-
🤝 Contact us if you have any questions or suggestions! You can also send us Feature Request (First Response Time ≤ 4 hours).